


1-20
Cisco ASDM User Guide
OL-16647-01
Chapter 1 Welcome to ASDM
Home Pane
Firewall Dashboard Tab
The Firewall Dashboard tab lets you view important information about the traffic passing through your
security appliance, including the number of connections, NAT translations, dropped packets, attacks, and
top usage statistics.
The Traffic Overview statistics are enabled by default. If you disable basic threat detection (see the
“Configuring Basic Threat Detection” section on page 27-1), then this tab includes an Enable button that
lets you enable basic threat detection.
The Top 10 Access Rules are also enabled by default. If you disable threat detection statistics for access
rules (see the
“Configuring Threat Statistics” section on page 27-4), then this tab includes an Enable
button that lets you enable statistics for access rules.
The Top Usage Status statistics are disabled by default. This tab includes Enable buttons that let you
enable the features, or you can enable them according to the
“Configuring Threat Statistics” section on
page 27-4. The Top 10 Services Enable button enables statistics for both ports and protocols (both must
be enabled for the display). The Top 10 Sources and Top 10 Destinations Enable buttons enable statistics
for hosts.
Caution Enabling statistics can affect the security appliance performance, depending on the type of statistics
enabled. Enabling statistics for hosts affects performance in a significant way; if you have a high traffic
load, you might consider enabling this type of statistics temporarily. Enabling statistics for ports,
however, has modest impact.
Fields
• Traffic Overview—Display only. Shows runtime statistics, including the number of connections,
NAT translations, and dropped packets.
–
Connection Statistics—Display only. Shows the number of connections and NAT translations.
–
Dropped Packets Rate—Display only. Shows the rate of dropped packets per second caused by
access list denials and application inspections.
–
Possible Scan and SYN Attack Rates—Display only. Shows the rate of dropped packets per
second that are identified as part of a scanning attack, or that are incomplete sessions detected,
such as TCP SYN attack detected or no data UDP session attack detected.
• Top 10 Access Rules—Display only. Shows the most active access rules.
–
Interval—Lets you view information based on the interval you choose. Available values are Last
1 hour, Last 8 hours, and Last 24 hours.
–
Based on—Display only. Shows that this statistic shows number of packet hits only.
–
Display—Lets you view the same information in three different formats: Table, Pie, or Bar.
–
Interface—Shows the interface to which the rule is applied.
–
Rule#—Shows the rule number used.
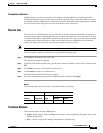
Firewall Mode Security Context
Routed Transparent Single
Multiple
Context System
• • • • —