


46-5
Cisco ASDM User Guide
OL-16647-01
Chapter 46 Monitoring Failover
Monitoring Failover in Single Context Mode or in a Security Context
Fields
• Available Graphs for—Lists the types of statistical information available for monitoring. You can
choose up to four statistic types to display in one graph window. Double-clicking a statistic type in
this field moves it to the Selected Graphs field. Single-clicking a statistic type in this field selects
the entry. You can select multiple entries.
The following types of statistics are available in graph or table format in the graph window. They
show the number of packets sent to and received from the other unit in the failover pair.
–
RPC services information—Displays the security appliance RPC service information.
–
TCP Connection Information—Displays the security appliance TCP connection information.
–
UDP Connection Information—Displays the security appliance UDP connection information.
–
ARP Table Information—Displays the security appliance ARP table information.
–
L2Bridge Table Information—(Transparent Firewall Mode Only) Displays the layer 2 bridge
table packet counts.
–
Xmit Queue—(Single Mode Only) Displays the current, maximum, and total number of packets
transmitted.
–
Receive Queue—(Single Mode Only) Displays the current, maximum, and total number of
packets received.
• Graph Window—Shows the graph window name to which you want to add a statistic type. If you
have a graph window already open, a new graph window is listed by default. If you want to add a
statistic type to an already open graph, select the open graph window name. The statistics already
included in the graph window are shown in the Selected Graphs field, to which you can add
additional types (up to a maximum of four types per window).
• Add—Click this button to move the selected entries in the Available Graphs for field to the Selected
Graphs field.
• Remove—Removes the selected statistic type from the Selected Graphs field.
• Selected Graphs—Shows the statistic types you want to show in the selected graph window. You can
include up to four types. Double-clicking a statistic type in this field removes the selected statistic
type from the field. Single-clicking a statistic type in this field selects the statistic type. You can
select multiple statistic types.
• Show Graphs—Click this button to display a new or updated graph window with the selected
statistics.
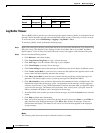
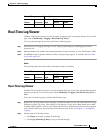
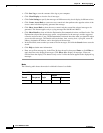
Modes
The following table shows the modes in which this feature is available:
For More Information
For more information about failover in general, see Understanding Failover.
Firewall Mode Security Context
Routed Transparent Single
Multiple
Context System
• • • •—