


44-16
Cisco ASDM User Guide
OL-16647-01
Chapter 44 Monitoring Properties
System Resources Graphs
–
RPC Requests to Target Hosts—Shows the packet count for the following signatures:
Port Registration (6100)
Port Unregistration (6101)
Dump (6102)
–
YP Daemon Portmap Requests—Shows the packet count for the following signatures:
ypserv Portmap Request (6150)
ypbind Portmap Request (6151)
yppasswdd Portmap Request (6152)
ypupdated Portmap Request (6153)
ypxfrd Portmap Request (6154)
–
Miscellaneous Portmap Requests—Shows the packet count for the following signatures:
mountd Portmap Request (6155)
rexd Portmap Request (6175)
–
Miscellaneous RPC Calls—Shows the packet count for the following signatures:
rexd Attempt (6180)
–
RPC Attacks—Shows the packet count for the following signatures:
statd Buffer Overflow (6190)
Proxied RPC (6103)
• Add—Click to add the selected graph type to the Selected Graphs list.
• Remove—Click to remove the selected graph type from the Selected Graphs list.
• Show Graphs—Click to display a new or updated graph window.
• Selected Graphs—Lists the graph types you want to show in the Selected Graphs list.
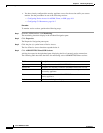
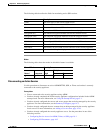
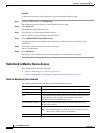
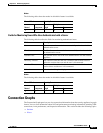
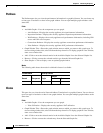
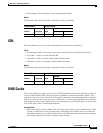
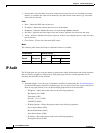
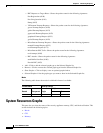
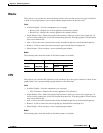
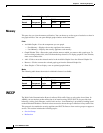
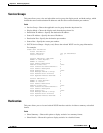
Modes
The following table shows the modes in which this feature is available:
System Resources Graphs
This pane lets you view the status of the security appliance memory, CPU, and block utilization. This
section includes the following topics:
• Blocks
• CPU
• Memory
Firewall Mode Security Context
Routed Transparent Single
Multiple
Context System
• • • •—