


Running Traces 633
About Trace Results The trace commands use the underlying logging mechanism to deliver
trace messages. Trace messages are generated with the debug severity
level. By default, the only log target that receives debug-level messages is
the volatile trace buffer. (To see the contents of the trace buffer, see
“Displaying Trace Results” on page 633.)
The volatile trace buffer receives messages for all log severities when any
trace area is active. However, if no trace area is active, no messages are
sent to the trace buffer regardless of their severity. If you do not enable
trace commands, the trace buffer is effectively disabled.
Because traces use the logging facility, any other logging target can be
used to capture trace messages if its severity is set to debug. However,
since tracing can be voluminous, 3Com discourages this in practice. To
enable trace output to the console, enter the command set log console
severity debug.
If you attempt to send trace output to a Telnet session, be aware that
tracing is disabled for areas processing packets that might be associated
with the Telnet session.
Displaying Trace
Results
To view the output of currently running trace commands, use the
following command:
display log trace [{+|-|/}number-of-messages]
[facility facility-name] [matching string]
[severity severity-level]
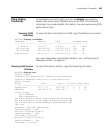
For example, the following command displays a trace log of error-level
events:
WX1200# display log trace severity error
KERNEL Jan 15 23:08:10 ERROR duplicate IP address
10.7.122.102 sent from link address 00:05:5d:45:ae:cd
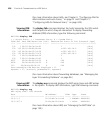
To display a specific number of trace log messages, you must enter a plus
sign (+), minus sign (-), or slash (/) before the number. These characters
filter the messages displayed as follows:
+number-of-messages — Displays the specified number of log entries,
starting with the oldest in the log.
-number-of-messages — Displays the specified number of entries,
starting with the newest in the log.