


8-4 PPC405 Core User’s Manual
8.4 Processor Status
The processor execution status, exception status, and most recent reset can be monitored.
8.5 Debug Registers
Several debug registers, available to debug tools running on the processor, are not intended for use
by application code. Debug tools control debug resources such as debug events. Application code
that uses debug resources can cause the debug tools to fail, as well as other unexpected results,
such as program hangs and processor resets.
Application code should not use the debug resources, including the debug registers.
8.5.1 Debug Control Registers
The debug control registers (DBCR0 and DBCR1) can enable and configure debug events, reset the
processor, control timer operation during debug events, enable debug interrupts, and set the
processor debug mode.
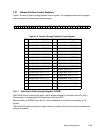
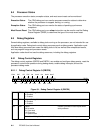
8.5.1.1 Debug Control Register 0 (DBCR0)
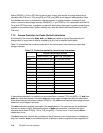
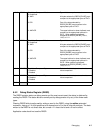
Execution Status The JTAG debug port can monitor processor execution status to determine
whether the processor is stopped, waiting, or running.
Exception Status The JTAG debug port can monitor the status of pending synchronous
exceptions.
Most Recent Reset The JTAG debug port or an mfspr instruction can be used to read the Debug
Status Register (DBSR) to determine the type of the most recent reset.
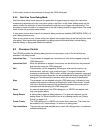
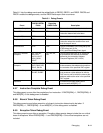
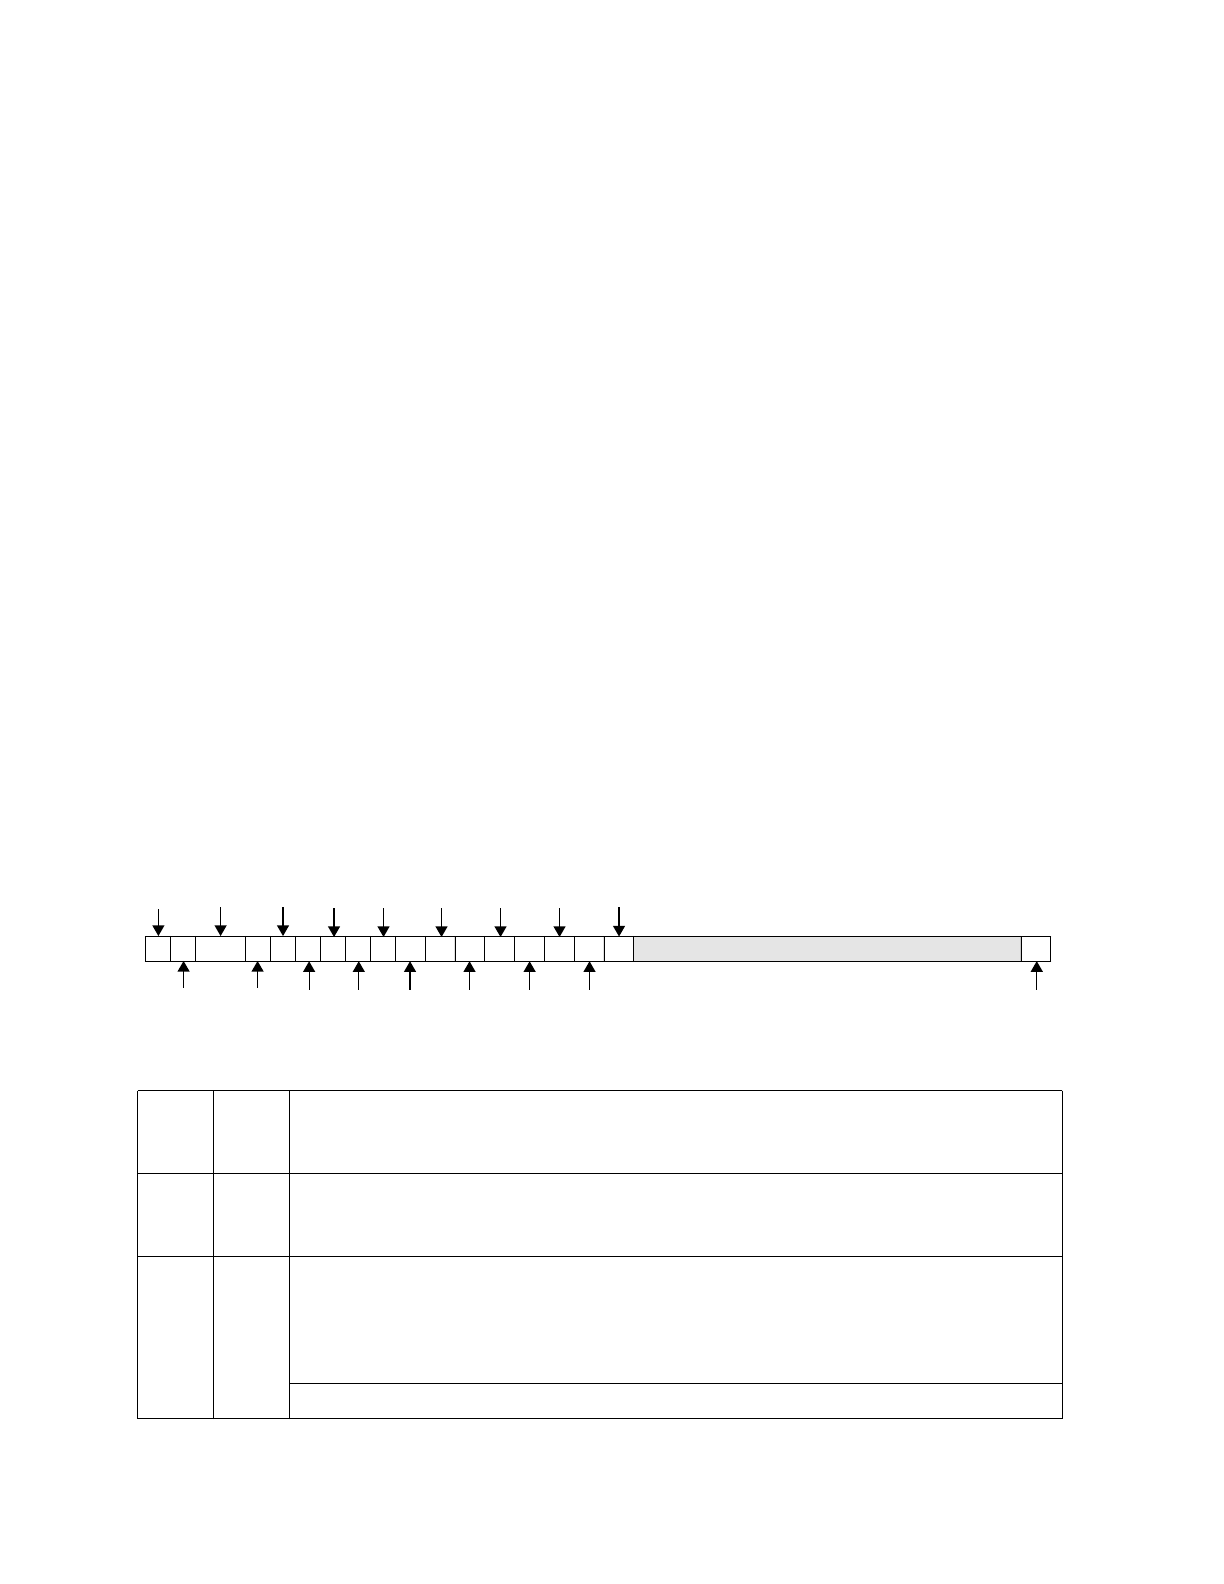
Figure 8-1. Debug Control Register 0 (DBCR0)
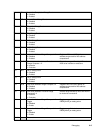
0 EDM External Debug Mode
0 Disabled
1 Enabled
1 IDM Internal Debug Mode
0 Disabled
1 Enabled
2:3 RST Reset
00 No action
01 Core reset
10 Chip reset
11 System reset
Causes a processor reset request when
set by software.
Attention: Writing 01, 10, or 11 to this field causes a processor reset request.
0 1 2 3 4 5 6 7 8 9 10 11 12 13 14 15 16 17 18 30 31
EDM
IDM
RST
IC
EDE
BT
IA1 IA34
TDE
FT
IA12
IA2
IA3
IA12X IA4
IA12T
IA34X
IA34T