


8-22 PPC405 Core User’s Manual
robust extensions that can be used for internal test generation and to write software for hardware
debug and diagnostics.
The primary components of BSDL include the logical port description, the physical pin map, the
instruction set, and the boundary register description.
The logical port description assigns symbolic names to the pins of a chip. Each pin has a logical type
of in, out, inout, buffer, or linkage that defines the logical direction of signal flow.
The physical pin map correlates the logical ports of the chip to the physical pins of a specific package.
A BSDL description can have several physical pin maps; each map is given a unique name.
Instruction set statements describe the bit patterns that must be shifted into the Instruction Register to
place the chip in the various test modes defined by the standard. Instruction set statements also
support descriptions of instructions that are unique to the chip.
The boundary register description lists each cell or shift stage of the Boundary Register. Each cell has
a unique number: the cell numbered 0 is the closest to the Test Data Out (TDO) pin; the cell with the
highest number is closest to the Test Data In (TDI) pin. Each cell contains additional information,
including: cell type, logical port associated with the cell, logical function of the cell, safe value, control
cell number, disable value, and result value.
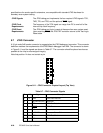
8.8 Trace Port
The PPC405 core implements a trace status interface to support the tracing of code running in real-
time. This interface enables the connection of an external trace tool, such as RISCWatch, and allows
for user-extended trace functions. A software tool with trace capability, such as RISCWatch with
RISCTrace, can use the data collected from this port to trace code running on the processor. The
result is a trace of the code executed, including code executed out of the instruction cache if it was
enabled. Information on trace capabilities, how trace works, and how to connect the external trace
tool is available in
RISCWatch Debugger User’s Guide
.