108 Hardware Reference Manual
Intel
®
IXP2800 Network Processor
Intel XScale
®
Core
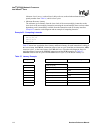
Some typical combination of counted events are listed in this section and summarized in Table 25.
In this section, we call such an event combination a mode.
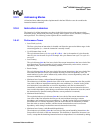
3.8.1.1 Instruction Cache Efficiency Mode
PMN0 totals the number of instructions that were executed, which does not include instructions
fetched from the instruction cache that were never executed. This can happen if a branch
instruction changes the program flow; the instruction cache may retrieve the next sequential
instructions after the branch, before it receives the target address of the branch.
PMN1 counts the number of instruction fetch requests to external memory. Each of these requests
loads 32 bytes at a time.
Statistics derived from these two events:
• Instruction cache miss-rate. This is derived by dividing PMN1 by PMN0.
• The average number of cycles it took to execute an instruction or commonly referred to as
cycles-per-instruction (CPI). CPI can be derived by dividing CCNT by PMN0, where CCNT
was used to measure total execution time.
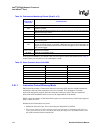
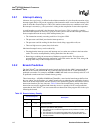
0x7 Instruction executed.
0x8
Stall because the data cache buffers are full. This event will occur every cycle in which the
condition is present.
0x9
Stall because the data cache buffers are full. This event will occur once for each contiguous
sequence of this type of stall.
0xA Data cache access, not including Cache Operations
0xB Data cache miss, not including Cache Operations
0xC
Data cache write-back. This event occurs once for each ½ line (four words) that are written
back from the cache.
0xD
Software changed the PC. This event occurs any time the PC is changed by software and
there is not a mode change. For example, a mov instruction with PC as the destination will
trigger this event. Executing a swi from User mode will not trigger this event, because it will
incur a mode change.
0x10 — 0x17
Refer to the Intel
®
IXP2400 and IXP2800 Network Processor Programmer’s Reference
Manual for more details.
all others Reserved, unpredictable results
Table 24. Performance Monitoring Events (Sheet 2 of 2)
Event Number
(evtCount0 or
evtCount1)
Event Definition
Table 25. Some Common Uses of the PMU
Mode PMNC.evtCount0 PMNC.evtCount1
Instruction Cache Efficiency 0x7 (instruction count) 0x0 (ICache miss)
Data Cache Efficiency 0xA (Dcache access) 0xB (DCache miss)
Instruction Fetch Latency 0x1 (ICache cannot deliver) 0x0 (ICache miss)
Data/Bus Request Buffer Full 0x8 (DBuffer stall duration) 0x9 (DBuffer stall)
Stall/Writeback Statistics 0x2 (data stall) 0xC (DCache writeback)
Instruction TLB Efficiency 0x7 (instruction count) 0x3 (ITLB miss)
Data TLB Efficiency 0xA (Dcache access) 0x4 (DTLB miss)


