Hardware Reference Manual 383
Intel
®
IXP2800 Network Processor
Performance Monitor Unit
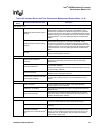
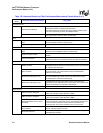
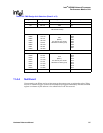
Table 152. Hardware Blocks and Their Performance Measurement Events (Sheet 1 of 2)
Hardware
Block
Performance Measurement Event Description
Intel XScale
®
Core
DRAM Read Head of Queue Latency
Histogram
The Intel XScale
®
core generates a read or write command to the
DRAM primarily to either push or pull data of the DDRAM. These
commands are scheduled to the DRAM through the push-pull arbiter
through a command FIFO in the gasket. The DRAM-read head of queue
enables the PMU to monitor when the read and write commands posted
by the Intel XScale
®
core in the gasket gets fetched and delivered to
DDRAM.
SRAM Read Head of Queue Latency
Histogram
The Intel XScale
®
core generates a read or write command to the
SRAM primarily to either push or pull data of the SRAM. These
commands are scheduled to the SRAM through the push-pull arbiter
through a command FIFO in the gasket. The SRAM-read head of queue
enables the PMU to monitor when the read and write commands posted
by the Intel XScale
®
core in the gasket gets fetched and delivered to
SRAM.
Interrupts
Number of interrupts seen.
Histogram of time between interrupts.
Microengines
Command FIFO Number of
Commands
These statistics give the number of the commands issued by the
Microengine in a particular period of time. It also can count each
different thread.
Control Store Measures
Count time between two microstore locations (locations can be set by
instrumentation software).
Histogram time between two microstore locations (locations can be set
by instrumentation software)
Execution Unit Status
Histogram of stall time. Histogram of aborted time. Histogram of
swapped out time. Histogram of idle time.
Command FIFO Head of Queue Wait
Time Histogram (Latency)
This is to measure the latency of a command, which is at the head of
the queue and is waiting to be sent out to the destination over the
chassis.
SRAM
SRAM Commands
A count of SRAM commands received. These are maskable by
command type such as Put and Get.
SRAM Bytes, Cycles Busy
This measurement describes the number of bytes transferred and the
SRAM busy time.
Queue Depth Histogram
This measurement analyzes the different queues such as ordered,
priority, push queue, pull queue, read lock fail, and HW queues, and
provides information about utilization.
DRAM
DRAM Commands
This measurement lists the total commands issued to the DRAM, and
they can be counted based on command type and error type.
DRAM Bytes, Cycles Busy
This measurement indicates the DRAM busy time and bytes
transferred.
Maskable by Read/Write,
Microengine, PCI, or the Intel XScale
®
Core
This measurement indicates the different accesses that are initiated to
the DRAM. These measurements could be for all the accesses to the
memory or can be masked using a specific source such as PCI, the
Intel XScale
®
core, or Microengine. This can further be measured
based on read or write cycles.


