378 Hardware Reference Manual
Intel
®
IXP2800 Network Processor
Performance Monitor Unit
11.1.4 Basic Operation of the Performance Monitor Unit
At power-up, the Intel XScale
®
core invokes the performance monitoring software code. The PMU
software has the application code to generate different types of data, such as histograms and
graphs. It also has a device driver to configure and read data from the PMU in the IXP2800
Network Processor. This software programs the configuration registers in the PMU block to
perform a certain set of monitoring and data collection. PMU CHAP counters execute the
commands programmed by the Intel XScale
®
core and they collect various types of data such as
latency and counts. Upon collection, it triggers an interrupt to the Intel XScale
®
core to indicate the
completion of monitoring.
The Intel XScale
®
core either periodically monitors the PMU registers or waits for an interrupt to
collect the observed data. The Intel XScale
®
core uses the APB to communicate with the PMU
configuration registers.
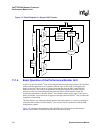
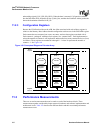
Figure 138 represents a block diagram of the IXP2800 Network Processor and Performance
Monitor Unit’s (PMU) in relation to other hardware blocks in the chip.
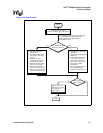
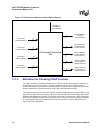
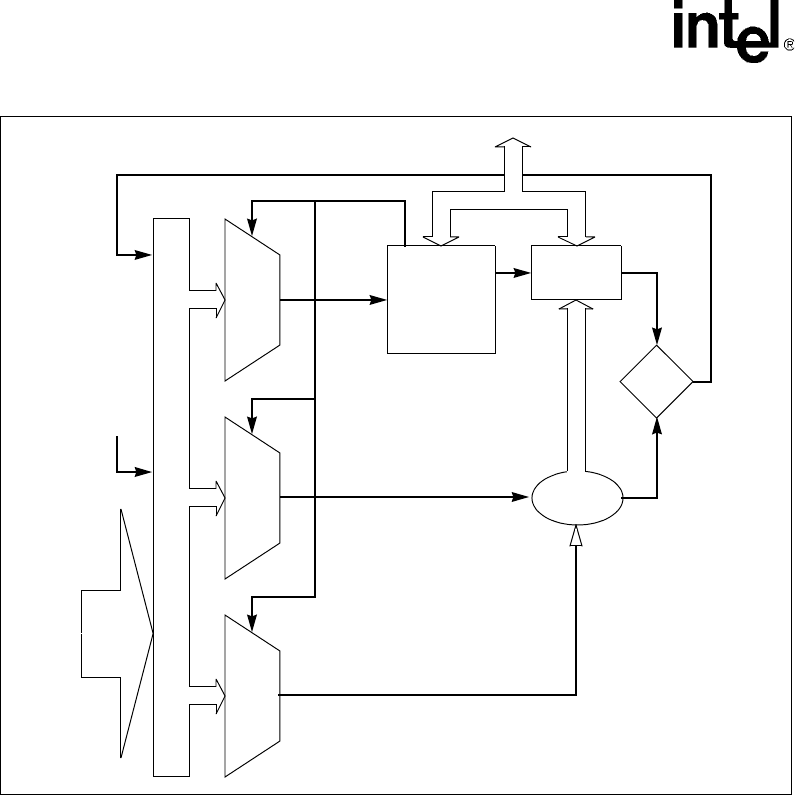
Figure 137. Block Diagram of a Single CHAP Counter
Command
Trigger
Increment
Event
Decrement
Event
Signals
from
Internal
Units
External Input Event
Event Preconditioning
32b Register Access Bus
Command,
Status, &
Event
Registers &
control logic
Data
Register
Counter
>=<


