


571 | Spectrum Analysis DellPowerConnectW-SeriesArubaOS6.2 | User Guide
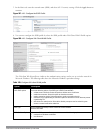
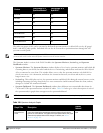
Device
Configurable as a
Spectrum Monitor?
Configurable as a
Hybrid AP?
W-AP105 Yes Yes
W-AP92 Yes Yes
W-AP93 Yes Yes
W-AP93H Yes No
W-AP120 Series Yes No
W-AP130 Series Yes Yes
W-AP175 Series Yes No
W-IAP3WN Series Yes No
The radios on groups of APs can be converted to dedicated spectrum monitors or hybrid APs via the AP group’s
dot11a and dot11g radio profiles. Individual APs can also be converted to spectrum monitors through the AP’s
spectrum override profile.
NOTE: The spectrum analysis feature requires the RF Protect license. In order to convert an AP to a spectrum monitor or hybrid AP,
you must have an AP license
and
an RF protect license for each AP on that controller.
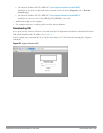
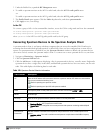
The Spectrum Analysis section of the WebUI includes the Spectrum Monitors, Session Log, and Spectrum
Dashboards windows.
l Spectrum Monitors: The Spectrum Monitors window displays a list of active spectrum monitors and hybrid APs
streaming data to your client, the radio band the device is monitoring, and the date and time the SM or hybrid
AP was connected to your client. This window allows you to select the spectrum monitors or hybrid APs for
which you want to view information, and release the connection between your client and any device you no
longer want to view.
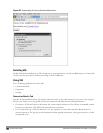
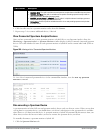
l Session Log: This tab displays activity for spectrum monitors and hybrid APs during the current browser session,
including timestamps showing when the devices were connected to and disconnected from the client, and any
changes to a hybrid APs monitored channel.
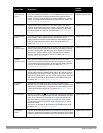
l Spectrum Dashboards: The Spectrum Dashboards window shows different user-customizable data charts for
2.4Ghz and 5 GHz spectrum monitor or hybrid AP radios. Table 194 below gives a basic description of each of
the spectrum analysis graphs that can appear on the spectrum dashboard
NOTE: For more detailed information on these graphs, refer to "Customizing Spectrum Analysis Graphs" on page 582.
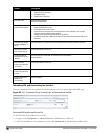
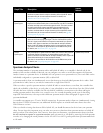
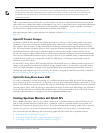
Graph Title Description
Update
Interval
Active Devices
Table
A pie chart showing the percentages and total numbers of each device
type for all active devices. This graph has no set update interval; the graph
automatically updates when values change. For details, see "Active
Devices" on page 583.
N/A
Table 194:
Spectrum Analysis Graphs