


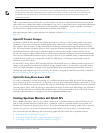
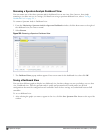
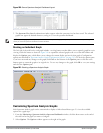
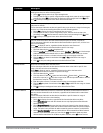

Figure 200: Save a Spectrum Analysis Dashboard Layout
2. The Spectrum View Saved confirmation window appears when the spectrum view has been saved. The selected
graphs now appear by default whenever you log in to view the spectrum dashboard.
NOTE: If you change graphs in a spectrum view but do not save your settings, you are prompted to save or cancel your changes
when you close the spectrum dashboard browser window
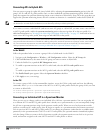
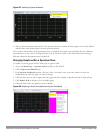
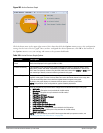
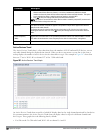
Resizing an Individual Graph
The left side of the title bar for each graph includes a resizing button on that allows you to expand a graph for easier
viewing. Click this button as shown in Figure 201 to expand the selected graph to the size of the full window and
display the Options pane, which allows you to change the current display options for that graph. (Configuration
options are described in "Spectrum Analysis Graph Configuration Options" on page 583). To close the options pane
if you have not made any changes to the graph, click Close at the bottom of the Options pane
or
click the resize
button again to return the graph to its original size. To save any changes to the graph, click OK to save your settings
and close the Options pane.
Figure 201: Resizing a Spectrum Analysis Graph
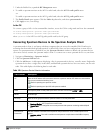
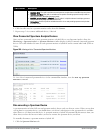
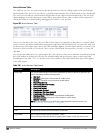
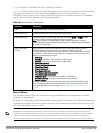
Customizing Spectrum Analysis Graphs
Each Spectrum Analysis graph can be customized to display or hide selected data types. To view the available
options for a graph type:
1. From the Monitoring>Spectrum Analysis>Spectrum Dashboards window, click the down arrow at the end of
the title bar for the graph you want to configure.
2. Select Options. The Options window appears to the right of the graph.
DellPowerConnectW-SeriesArubaOS6.2 | User Guide Spectrum Analysis | 582