


616 | DashboardMonitoring DellPowerConnectW-SeriesArubaOS6.2 | User Guide
l Overall goodput
l Percentage of frames dropped
l Frame rate distribution of the APs
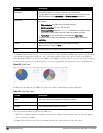
Additionally, you can view the distribution of the APs in different noise floor ranges, channel utilization ranges, and
non-Wi-Fi interference ranges using the histograms. To understand histogram information, see "Using Dashboard
Histograms" on page 616.
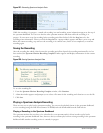
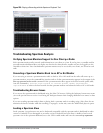
Using Dashboard Histograms
Dashboard histograms are a visual representation of the distribution of the wireless clients, access points, and radios
across different performance parameters in the controller. Histograms help you to quickly identify any performance
issues in the network from the color of the distribution. For example, critical ranges of the distribution are
highlighted in red and the normal ranges are highlighted in green.
You can view the number of clients or APs falling in each range of the distribution with a hyperlink. You can also
perform the following tasks on the histograms to get additional information on the clients and APs in the
distribution:
l View Client or AP details: Click the hyperlinked number to view the details of the clients or APs in a pop-up
window.
l Sort: Click a column header of the clients or APs table to sort the complete list based on the entries on the
active column. You can also use the sort icon that appears when you click on a column for sorting.
l Filter: Click the filter icon and select the filter criterion on any column to filter the entries.
l Customize column view: Select or deselect the columns to view or hide by doing a right click on the clients or
AP table header.
l Close pop-up window: Click on the close icon to close the client or AP details pop-up window.
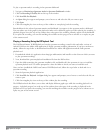
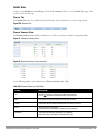
Monitoring Usage
This page displays the usage details of the clients and APs on the controller.
Clients
This section displays the client and WLAN utilization in the controller. You can view the trends of the following
client usage details in the last 15 minutes:
l Number of wireless clients connected to the controller
l Number of active wireless clients
l Number of wireless clients that have low usage
l Number of wireless clients associated per WLAN
Additionally, you can click on the hyperlinked number to view the respective client details on the Clients page.
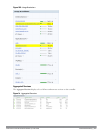
APs
This section displays the AP utilization in the controller. You can view the following AP and radio details:
l Number of APs
l Number of APs that are down
l Radios with low usage
l Overall AP usage