


618 | DashboardMonitoring DellPowerConnectW-SeriesArubaOS6.2 | User Guide
l Customize column view: Select or deselect the columns to view or hide by doing a right click on the details table
header. You can also choose one of the following system defined views that have the appropriate pre-selected
columns.
n Default Columns
n To/From Client Stats
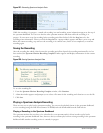
l View WLAN trends: View the trends of the clients connected in the WLAN and the WLAN usage in the last 15
minutes.
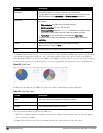
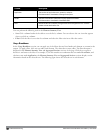
l View client summary: Click on the hyperlinked client name on the client details table to view the Client
Summary page. In this page, you can view the client details summary (air quality metrics and from and to clients
statistics), bandwidth of the client usage, trend of the client frame loss in the last 15 minutes, and the frame rate
distribution of the client.
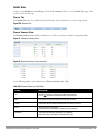
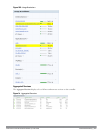
l View AP or radio summary: Click on the hyperlinked AP name or the radio band on the AP details table to view
the Access Points page. In this page you can view the summary of the AP details such as air quality metrics,
from and to clients statistics, and the number of clients associated with the AP under different SNR ranges.
Additionally, you can view the details of the associated clients and WLANs.
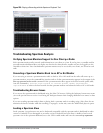
Monitoring Access Points
You can view the details of all the radios and APs associated with the controller by selecting the respective tab. You
can also view the trends of the connected wireless clients and the client usage under the 2.4 Ghz and 5 Ghz radio
bands in the last 15 minutes.
You can perform the following tasks on this page:
l Sort: Click a column header of the AP table to sort the complete list based on the entries on the active column.
You can also use the sort icon that appears when you click on a column for sorting.
l Filter: Click the filter icon and select the filter criterion on any column of the details table to filter the entries.
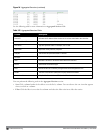
l Customize column view: Select or deselect the columns to view or hide by doing a right click on the details table
header. You can also choose one of the following system defined views that have the appropriate pre-selected
columns.
n Default Columns
n Air Quality Metrics
n To/From Client Stats
l View client details: Click on the number of clients associated with the AP to view the details of the clients on
the Clients page.
l View AP or radio summary: Click on the hyperlinked AP name or the radio band on the AP details table to view
the summary of the AP details such as air quality metrics, from and to clients statistics, and the number of
clients associated with the AP under different SNR ranges. Additionally, you can view the details of the
associated clients and WLANs.
Monitoring Clients
You can view the details of all the wireless clients on the controller. You can also view the trends of the connected
clients and the client usage under the 2.4 Ghz and 5 Ghz radio bands in the last 15 minutes.
You can perform the following tasks on this page:
l Sort: Click a column header of the AP table to sort the complete list based on the entries on the active column.
You can also use the sort icon that appears when you click on a column for sorting.
l Filter: Click the filter icon and select the filter criterion on any column of the details table to filter the entries.