


587 | Spectrum Analysis DellPowerConnectW-SeriesArubaOS6.2 | User Guide
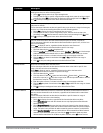
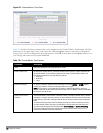
Parameter Description
whose transmissions affect any channel, or click the checkboxes by individual channel
numbers to show only those devices whose output affect those selected channels. This option
is only available for tables created by spectrum monitors, not hybrid APs.
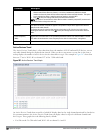
l Click OK to save your settings and return to the Active Devices table.
NOTE: This option is not available for Active Devices tables created by a hybrid AP, because each
hybrid AP monitors a single channel only.
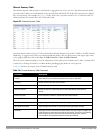
Device ID The spectrum monitor or hybrid AP applies a unique device ID per device type to each device it
detects on the radio channel.
To display the entry for a device that matches a single device ID, click the icon in the column
heading and enter the device ID. Click OK to save your settings and return to the Active Devices
table.
Center Frequency
(MHz)
Signals from a wireless device can spread beyond the boundaries of an individual 802.11 channel.
This table column shows the center frequency for the device’s transmission, in megahertz.
Occupied Bandwidth Channel bandwidth used by the device, in megahertz.
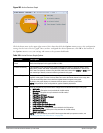
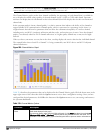
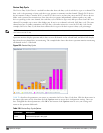
Active Devices Trend
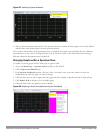
The Active Devices Trend chart is a line chart that shows the numbers of Wi-Fi and non-Wi-Fi devices seen on
each radio channel during the displayed time interval. When you hover your mouse over any line in the chart, a
tooltip displays the number of active devices for the selected device type. The example in Figure 207 shows that
there are 27 active Wi-Fi APs on channel 157 of the 5 GHz radio band.
Figure 207: Active Devices Trend Graph
An Active Devices Trend chart created by a hybrid AP displays data for the single channel monitored by that device.
For spectrum monitors, the Active Devices Trend chart can display values for up to five different channels and
device types. These graphs show the following data by default:
l For SMs on the 2.4 GHz radio band, Wi-Fi APs on channel 1, 6 and 11.