


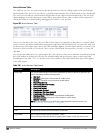
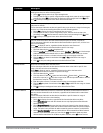
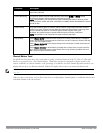
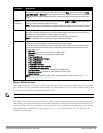

Parameter Description
the 2.4 GHz radio band.
Channel Numbering For spectrum monitors using the 5 GHz radio band, select either 20 MHz or 40 MHz channel
numbering to identify a channel numbering scheme for the graph.
NOTE: This parameter is not configurable for graphs created by hybrid APs or spectrum monitor
radios that use the 2.4 GHz radio band. A hybrid AP on a 20 MHz channel sees 40 MHz Wi-Fi data as
non-Wi-Fi data.
Channel Range For graphs created by spectrum monitors, specify a channel range to determine which channels
appear in this graph. Click the first drop-down list to select the lowest channel in the range, then
click the second drop-down list to select the highest channel to appear in the graph.
By default, this graph d>isplays all channels within the spectrum monitor’s radio band.
NOTE: This parameter is not configurable for graphs created by hybrid APs.
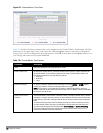
Display Mode Select Channel Quality to show the relative quality of the channel. Channel Quality is a weighted
metric derived from key parameters which include noise, non-Wi-Fi (interferer) utilization and duty-
cycles, and certain types of retries.
Select Channel Availability to show the percentage of the channel that is unused and available for
additional Wi-Fi traffic.
Select Channel Utilization to show both the percentage of the channel that is currently utilized by
Wi-Fi devices, and the percentage of each channel that is being utilized by non-802.11 devices or
802.11 adjacent channel interference (ACI).
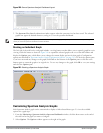
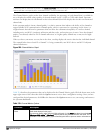
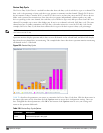
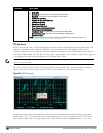
Channel Metrics Trend
By default, this line chart shows the current relative quality of selected channels in the 2.4 GHz or 5 GHz radio
bands over a period of time. The Channel Metrics Trend chart can also be configured to display trends for the
current availability of selected channels, or the percentage of availability for those channels.Spectrum monitors can
display data for up to five different channels. Hybrid APs display data for their one monitored channel only.
NOTE: For more information on how the spectrum analysis feature determines the quality of a channel, see "Channel Metrics" on
page 588.
When you hover your mouse over any line in the chart, a tooltip displays channel quality or availability data for that
individual channel at the selected time.
DellPowerConnectW-SeriesArubaOS6.2 | User Guide Spectrum Analysis | 590