


Parameter Description
band. This parameter is not configurable for graphs created by hybrid APs or spectrum monitor
radios that use the 2.4 GHz radio band.
Channel Numbering For spectrum monitors using the 5 GHz radio band, select either 20 MHz or 40 MHz channel
numbering to identify a channel numbering scheme for the graph.
NOTE: This parameter is not configurable for graphs created by hybrid APs or spectrum monitor
radios that use the 2.4 GHz radio band.
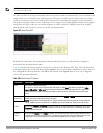
X-Axis Select either Channel or Frequency. to show FFT power or duty cycles for a range of channels or
frequencies. If you select Frequency, you must select the radio frequency on which this chart
should center, and determine the span of frequencies for the graph.
Channel Range If you selected Channel in the X-Axis parameter, you must also specify a channel range to
determine which channels appear in the x-axis of this chart. Click the first drop-down list to
select the lowest channel in the range, then click the second drop-down list to select the
highest channel to appear in the chart.
NOTE: This parameter is not configurable for graphs created by hybrid APs.
Center Frequency If you selected Frequency in the X-Axis parameter, enter the frequency, in MHz, that you want to
appear in the center of the x-axis of this chart.
Span If you selected Frequency in the X-Axis parameter, specify the size of the range of frequencies
around the selected center frequency. If you set a frequency span of 100 MHz, for example, the
chart shows the swept spectrogram for a range of frequencies from 50MHz lower to 50 MHz
higher than the selected center.
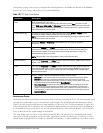
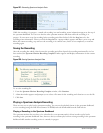
Color-Map Range
If this chart is configured to show average or maximum FFT values,
the default color range on
this chart represents values from -50dBm (red) to -90dBm (blue). If you would like the color range
on this chart to represent a different range of FFT power levels, enter this range in the from and
to entry blanks.
For example, if you defined a color-map range from -60 to -80, then any FFT power level at or
above -60 dBm would appear as red, and any FFT power level at or below -80 would appear
blue. Only the channel or frequency qualities between -60 dBm and -80 dBm would be
represented by gradiented colors within the color range.
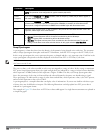
If this chart is configured to show the FFT duty cycle
, the default color range on this chart
represents duty cycles from 0% (red) to 100% (blue). If you would like the color range on this
chart to represent a different range of FFT duty cycle percentages, enter this range in the from
and to entry blanks.
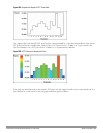
For example, if you defined a color-map range from 25 to 75, then any FFT duty cycle at or below
25% would appear as red, and any FFT duty cycle at or below 75% would appear blue. Only the
duty cycle levels between 25% and 75% would be represented by gradiented colors within the
color range.
NOTE: If your swept spectrogram is showing a single color only, you may need to increase the
color map range to display a greater range of values.
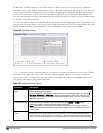
Show Select FFT Avg, FFT Max or FFT Duty Cycle to select the type of data you want to appear in this
chart.
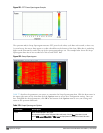
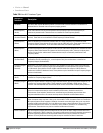
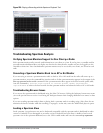
Working with Non-Wi-Fi Interferers
The following table describes each type of non-Wi-Fi interferer detected by the spectrum analysis feature. These
devices appear in the following charts:
l Active Devices
l Active Devices Table
l Active Devices Trend
l Device Duty Cycle
DellPowerConnectW-SeriesArubaOS6.2 | User Guide Spectrum Analysis | 606