


579 | Spectrum Analysis DellPowerConnectW-SeriesArubaOS6.2 | User Guide
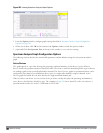
2. Each table entry in the Currently Connected table includes a Disconnect link to release the client’s connection
to that spectrum monitor. Identify the table entry for the spectrum monitor you want to release then click
Disconnect.
3. A popup window asks you to confirm that you want to disconnect the spectrum monitor from the spectrum
analysis client. Click OK. The spectrum monitor d>isconnects from the client and the device’s entry is removed
from the Currently Connected table.
When you disconnect a spectrum device from your client, the AP continues to operate as a spectrum monitor or
hybrid AP until you return the device to AP mode by removing the local spectrum override, or by changing the mode
parameter in the AP’s 802.11a or 802.11g radio profile from spectrum-mode to AP-mode
NOTE: If you are using Internet Explorer with multiple instances of the Internet Explorer browser open, and you close the spectrum
browser window without manually disconnecting the spectrum device, the controller does not release the data streaming connection
to aspectrum monitor until 60 seconds after you close the spectrum client browser window. During this 60-second period, the
spectrum monitor is still connected to the client.
Configuring the Spectrum Analysis Dashboards
Once you have connected spectrum monitors to your spectrum analysis client, you can begin to monitor spectrum
data in the spectrum analysis dashboards. There are three predefined sets of dashboard views,
View 1
,
View 2
and
View 3
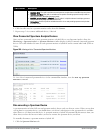
. By default, View 1 displays the Real-Time FFT, FFT Duty-Cycle and Swept Spectrogram graphs, and Views
2 and 3 display the Swept Spectrogram and Quality Spectrogram charts, and the Channel Summary and Active
Devices tables.
Each chart in the dashboard can be replaced with other chart types, or reconfigured to show data for a different
spectrum monitor. Once you have configured a dashboard view with different settings, you can rename that
dashboard view to better reflect its new content.
The following sections explain how to customize your Spectrum Analysis dashboard to best suit the needs of your
individual network.
l "Selecting a Spectrum Monitor " on page 579
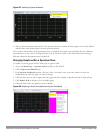
l "Changing Graphs within a Spectrum View" on page 580
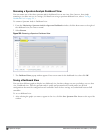
l "Renaming a Spectrum Analysis Dashboard View" on page 581
l "Saving a Dashboard View" on page 581
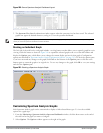
l "Resizing an Individual Graph" on page 582
Selecting a Spectrum Monitor
When you first log into the Spectrum Analysis dashboard, it d>isplays blank charts. You must identify the spectrum
monitor whose information you want to view before the graphs display any data.
To identify the spectrum monitor radio whose data you want to appear in the Spectrum Analysis dashboard:
1. Access the Monitoring > Spectrum Analysis window in the WebUI.
2. Click the Spectrum Dashboards tab.
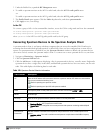
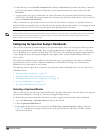
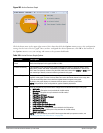
3. In the graph title bar, click the d>own arrow by the Please select a spectrum monitor heading, as shown in
Figure 197. A drop-down list appears with the name of all spectrum monitor and hybrid AP radios currently
connected to the client.