


DellPowerConnectW-SeriesArubaOS6.2 | User Guide DashboardMonitoring | 615
Chapter 33
Dashboard Monitoring
The ArubaOS dashboard monitoring functionality provides enhanced visibility into your wireless network
performance and usage within a controller. This allows you to easily locate and diagnose WLAN issues in the
controller.
The dashboard monitoring is available via the WebUI. To monitor and troubleshoot RF issues in the WLAN, click
the Dashboard tab. The following pages in the Dashboard page allows you to view various performance and usage
information:
l Performance
l Usage
l Security
l Potential Issues
l WLANs
l Access Points
l Clients
l Firewall
Additionally, you can view the context sensitive help for each field in the Dashboard UI by clicking the help link at
the topmost right corner of the UI. The field for which the help has been defined appears as green. You can turn off
the help by clicking on the Done button.
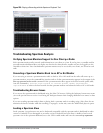
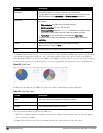
Monitoring Performance
This page displays the performance details of the wireless clients and APs connected to the controller.
Clients
This section displays the total number of wireless clients connected to the controller. You can view the distribution
of clients in different SNR ranges, associated data rate ranges, and data transfer speed ranges using the histograms.
You can click on the hyperlinked number to view the Clients page. Additionally, you can view the following client
performance details:
l Signal to noise ratio (SNR)
l Phy type
l Client connection speed
l Effective data rate of the clients connected to the controller
To understand histogram information, see "Using Dashboard Histograms" on page 616.
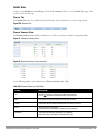
APs
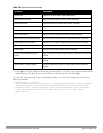
This section displays the following performance details of the APs on the controller:
l To client or from client frame rates