


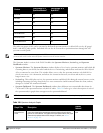

Graph Title Description
Update
Interval
Active Devices
Trend
A line chart showing the numbers of up to five different types of Wi-Fi and
non-Wi-Fi devices seen on selected channels during a specified time
interval. This chart can show devices on multiple channels for a spectrum
monitor, or the single monitored channel for a hybrid AP. For details, see
"Active Devices Trend" on page 587.
Updates every 5 seconds
Channel Metrics This stacked bar chart shows the current relative quality, availability or
utilization of selected channels in the 2.4 GHz or 5 GHz radio bands. This
chart can show multiple channels for a spectrum monitor, or the single
monitored channel for a hybrid AP. For details, see "Channel Metrics" on
page 588.
Updates every 5 seconds
Channel Metrics
Trend
A line chart showing the relative quality or availability of selected channels
in the 2.4 GHz or 5 GHz radio bands over a specified time interval.
Spectrum monitors can show channel data for multiple channels, while a
hybrid AP shows information only for its one monitored channel. For
details, see "Channel Metrics Trend" on page 590.
Updates every 5 seconds
Channel
Summary Table
The Channel Summary table displays the number of devices found on each
channel in the spectrum monitor’s radio band, the percentage of channel
utilization, and AP power and interference levels. Spectrum monitors can
show data for multiple channels, while a hybrid AP shows a channel
summary only for its one monitored channel. For details, see "Channel
Summary Table" on page 592.
Updates every 5 seconds
Channel
Utilization Trend
A line chart that shows the channel utilization for one or more radio
channels, as measured over a defined time interval. Spectrum monitors
can show data for multiple channels, while a hybrid AP shows utilization
levels for its one monitored channel only. For details, see "Channel
Utilization Trend" on page 594.
Updates every 5 seconds
Device Duty Cycle A stacked bar chart showing the percent of each channel in the spectrum
monitor radio’s frequency band utilized by a Wi-Fi AP or any other device
type detected by the spectrum monitor. The Device Duty Cycle chart for a
hybrid AP only shows data for the one channel monitored by the hybrid AP.
This chart is not available for W-AP120 Series or W-AP68 access points.
For details, see "Device Duty Cycle" on page 593.
Updates every 5 seconds
Devices vs
Channel
A stacked bar chart showing the total numbers of each device type
detected on each channel in the spectrum monitor radio’s frequency band.
The Devices vs Channel chart for a hybrid AP only shows data for the one
channel monitored by the hybrid AP. For details, see "Devices vs Channel"
on page 595.
Updates every 5 seconds
FFT Duty Cycle Fast Fourier Transform, or FFT, is an algorithm for computing the frequency
spectrum of a time-varying input signal. This line chart shows the FFT duty
cycle, which represents the percent of time a signal is broadcast on the
specified channel or frequency. Spectrum monitors can show data for
multiple channels, while a hybrid AP shows information only for its one
monitored channel.
This chart is not available for W-AP120 Series or W-AP68 access points.
For details, see "FFT Duty Cycle" on page 597.
Updates every second
Interference
Power
This chart shows information about Wi-Fi interference, including the Wi-Fi
noise floor, and the amount of adjacent channel interference from cordless
phones, bluetooth devices and microwaves. Spectrum monitors can show
Updates every 5 seconds
DellPowerConnectW-SeriesArubaOS6.2 | User Guide Spectrum Analysis | 572