


601 | Spectrum Analysis DellPowerConnectW-SeriesArubaOS6.2 | User Guide
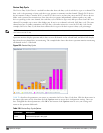
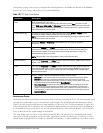
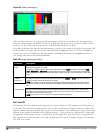
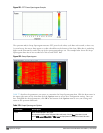
Figure 225: Quality Spectrogram
When you hover your mouse over any part of the spectrogram, a tooltip shows the devices the spectrum monitor
detected on that frequency, the BSSID of the device (if applicable), the power level of the device in dBm, the time
the device was last seen by the spectrum monitor, and the channels affected by the device.
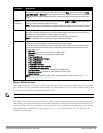
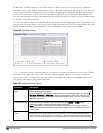
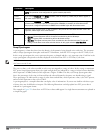
The following table describes the other optional parameters you can use to customize the Quality Spectrogram. Click
the down arrow in the upper right corner of this chart then click the Options menu to access these configuration
settings. Once you have configured the desired parameters, click OK at the bottom of the Options menu to save
your settings and return to the spectrum dashboards
Parameter Description
Band Radio band displayed in this graph.
For spectrum monitor radios using the 5 GHz radio band, click the Band drop-down list and select 5 GHz
upper, 5GHz middle or 5Ghz lower to display data for that portion of the 5Ghz radio band. This parameter
is not configurable for graphs created by hybrid APs or spectrum monitor radios that use the 2.4 GHz radio
band.
Channel
Numbering
For spectrum monitors using the 5 GHz radio band, select either 20 MHz or 40 MHz channel numbering to
identify a channel numbering scheme for the graph.
NOTE: This parameter is not configurable for graphs created by hybrid APs or spectrum monitor radios
that use the 2.4 GHz radio band. A hybrid AP on a 20 MHz channel sees 40 MHz Wi-Fi data as non-Wi-Fi
data.
Channel Range Specify a channel range to determine which channels appear in the x-axis of this chart. Click the first
drop-down list to select the lowest channel in the range, then click the second drop-down list to select
the highest channel to appear in the chart.
NOTE: This parameter is not configurable for graphs created by hybrid APs.
Table 226:
Quality Spectrogram Options
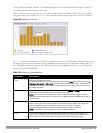
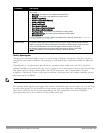
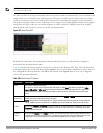
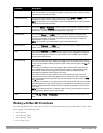
Real-Time FFT
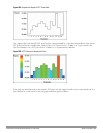
The Real-time FFT chart displays the instantaneous Fast Fourier Transform (FFT) signature of the RF signal seen
by the radio. The Fast Fourier Transform (FFT) converts a RF signal from time domain to frequency domain. The
frequency domain representation divides RF signals into discrete frequency bins; small frequency ranges whose width
depends on the resolution bandwidth of the spectrum monitor (i.e., how many Hz are represented by a single signal
strength value). Each frequency bin has a corresponding signal strength value. Since there may be a large number of
FFT signatures received by the radio every second, an algorithm selects one FFT sample to display in the Real-time
FFT chart every second.