


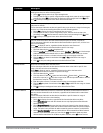
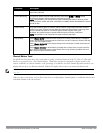
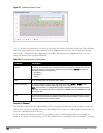
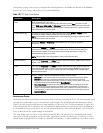

Parameter Description
For spectrum monitor radios using the 5 GHz radio band, click the Band drop-down list and select 5 GHz
upper, 5GHz middle or 5Ghz lower to display data for that portion of the 5Ghz radio band. This parameter is
not configurable for graphs created by hybrid APs or spectrum monitor radios that use the 2.4 GHz radio
band.
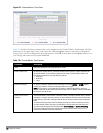
Channel
Numbering
For spectrum monitors using the 5 GHz radio band, select either 20 MHz or 40 MHz channel numbering to
identify a channel numbering scheme for the graph.
NOTE: This parameter is not configurable for graphs created by hybrid APs or spectrum monitor radios that
use the 2.4 GHz radio band. A hybrid AP on a 20 MHz channel sees 40 MHz Wi-Fi data as non-Wi-Fi data.
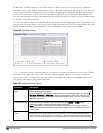
Channel Range For graphs created by spectrum monitors, specify a channel range to determine which channels appear in
this graph. Click the first drop-down list to select the lowest channel in the range, then click the second
drop-down list to select the highest channel to appear in the graph.
By default, this graph displays all channels within the spectrum monitor’s radio band.
NOTE: This parameter is not configurable for graphs created by hybrid APs.
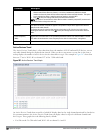
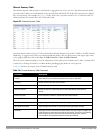
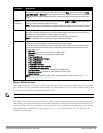
Show This graph can display values for up to five different device types on different channels for a spectrum
monitor, or a single device type for a hybrid AP monitoring a single channel.
To choose which type of data each line should represent, click the channel number drop-down list and
select a channel within the radio band, then click the device type drop-down list and select one of the
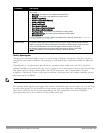
following device types
l WiFi (AP)
l Microwave
(This option is only available for 2.4 GHz radios)
l Bluetooth
(This option is only available for 2.4 GHz radios)
l Fixed Freq (Others)
l Fixed Freq (Cordless Phones)
l Fixed Freq (Video)
l Fixed Freq (Audio)
l Freq Hopper (Others)
l Freq Hopper (Cordless Network)
l Freq Hopper (Cordless Base)
l Freq Hopper Xbox
(This option is only available for 2.4 GHz radios)
l Microwave (Inverter)
(This option is only available for 2.4 GHz radios)
l Generic Interferer
NOTE: For more information on non-Wi-Fi device types detected by a spectrum monitor, see "Working
with Non-Wi-Fi Interferers " on page 606.
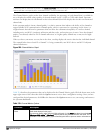
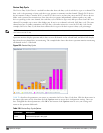
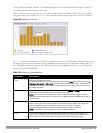
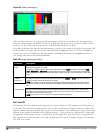
Channel Utilization Trend
The Channel Utilization Trend chart is a line chart that shows the percentage of total utilization on each channel
over a time interval. The channel utilization includes the utilization due to Wi-Fi as well as utilization due to non-
Wi-Fi interferers and Adjacent Channel Interference (ACI).
NOTE: For additional information on how the spectrum analysis feature measures ACI, see "Channel Metrics" on page 588.
This graph can show data recorded for the last ten, thirty, or sixty minutes. Spectrum monitors display spectrum
analysis data seen on all channels in the selected band, and hybrid APs display data from the one channel they are
monitoring. When you hover your mouse over any line in the chart, a tooltip shows the percentage of the channel
being utilized at the specified time. The example in Figure 217 shows that channel 1 was 70% utilized at the
selected time in the chart.
DellPowerConnectW-SeriesArubaOS6.2 | User Guide Spectrum Analysis | 594