


it affects all those channels. Similarly, if a channel-hopping device uses all channels within a frequency band, it is
counted as a device on all channels in that band.
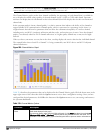
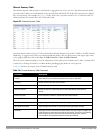
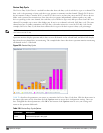
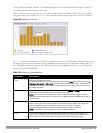
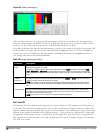
When you hover the mouse over any part of the chart, a tooltip shows the numbers of the device type currently
using that channel. The example in Figure 219 shows that the spectrum monitor can detect 42 APs on channel 5.
Figure 219: Devices vs Channel
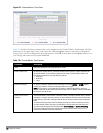
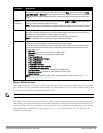
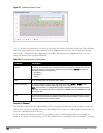
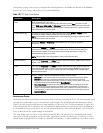
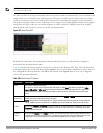
Table 220 describes the parameters you can use to customize the Devices vs Channel chart. Click the down arrow in
the upper right corner of this chart then click the Options menu to access these configuration settings. Once you
have configured the desired parameters, click OK at the bottom of the Options menu to save your settings and
return to the spectrum dashboards.
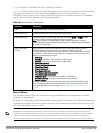
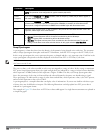
Parameter Description
Band Radio band displayed in this graph.
For spectrum monitor radios using the 5 GHz radio band, click the Band drop-down list and select 5
GHz upper, 5GHz middle or 5Ghz lower to display data for that portion of the 5Ghz radio band. This
parameter is not configurable for graphs created by hybrid APs or spectrum monitor radios that use
the 2.4 GHz radio band.
Channel Numbering For spectrum monitors using the 5 GHz radio band, select either 20 MHz or 40 MHz channel
numbering to identify a channel numbering scheme for the graph.
NOTE: This parameter is not configurable for graphs created by hybrid APs or spectrum monitor
radios that use the 2.4 GHz radio band. A hybrid AP on a 20 MHz channel sees 40 MHz Wi-Fi data as
non-Wi-Fi data.
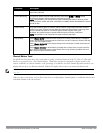
Channel Range For graphs created by spectrum monitors, specify a channel range to determine which channels
appear in this graph. Click the first drop-down list to select the lowest channel in the range, then
click the second drop-down list to select the highest channel to appear in the graph.
By default, this graph displays all channels within the spectrum monitor’s radio band.
NOTE: This parameter is not configurable for graphs created by hybrid APs.
Show This graph can show data for up to five different device types. To show how many devices of a
specific type are sending a signal on the selected channel range, click the show checkbox by that
device, then click the device drop-down list and select one of the following device types.
Table 220:
Devices vs Channel Options
DellPowerConnectW-SeriesArubaOS6.2 | User Guide Spectrum Analysis | 596