


599 | Spectrum Analysis DellPowerConnectW-SeriesArubaOS6.2 | User Guide
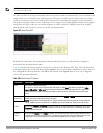
95 dBm and a 40 MHz channel has a noise floor around -92 dBm. Certain types of fixed-frequency continuous
transmitters such as video bridges, fixed-frequency phones, and wireless cameras typically elevate the noise floor seen
by the spectrum monitor. Other interferers such as frequency-hopping phones, Bluetooth and Xbox may not affect
the noise floor of the radio. A Wi-Fi radio can only reliably decode Wi-Fi signals that are a certain dB above the
noise floor and therefore estimating and understanding the actual noise floor of the radio is critical to understanding
the reliability of the RF environment.
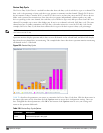
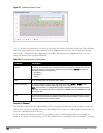
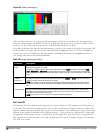
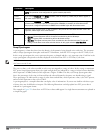
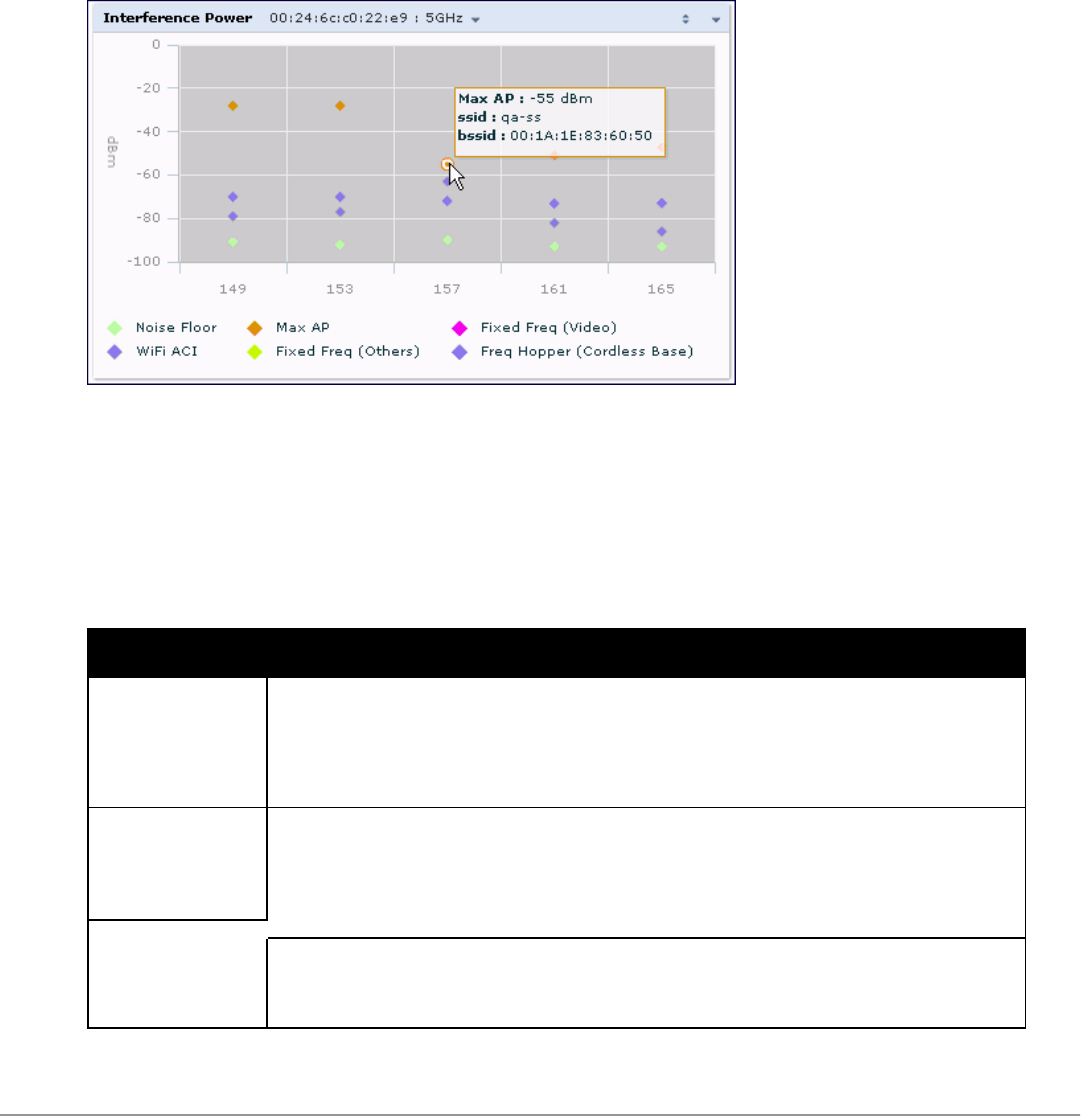
The chart also includes information about the AP on each channel with the highest power level. You can hover your
mouse over an AP on the chart to view the AP’s name, SSID and current power level. The example below shows that
the AP with the maximum power on channel 157 has the SSID qa-ss, and a power level of -55dBm.
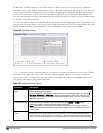
Figure 223: Interference Power
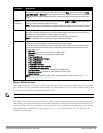
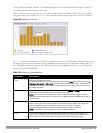
Table 224 describes the other optional parameters you can use to customize the interference power chart. Click the
down arrow in the upper right corner of this chart then click the Options menu to access these configuration
settings. Once you have configured the desired parameters, click OK at the bottom of the Options menu to save
your settings and return to the spectrum dashboards.
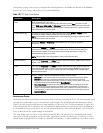
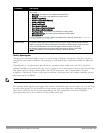
Parameter Description
Band Radio band displayed in this graph.
For spectrum monitor radios using the 5 GHz radio band, click the Band drop-down list and select 5
GHz upper, 5GHz middle or 5Ghz lower to display data for that portion of the 5Ghz radio band. This
parameter is not configurable for graphs created by hybrid APs or spectrum monitor radios that use
the 2.4 GHz radio band.
Channel Numbering For spectrum monitors using the 5 GHz radio band, select either 20 MHz or 40 MHz channel
numbering to identify a channel numbering scheme for the graph.
NOTE: This parameter is not configurable for graphs created by hybrid APs or spectrum monitor
radios that use the 2.4 GHz radio band. A hybrid AP on a 20 MHz channel sees 40 MHz Wi-Fi data as
non-Wi-Fi data.
Show By default, this chart displays data for the current noise floor, adjacent channel interference (ACI),
and the maximum AP power level for each channel. To display interference power levels form other
devices, click the show checkbox then click the show drop-down list and select one of the following
Table 224:
Interference Power Options