


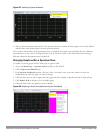

l For SMs on the 5 GHz band, Wi-Fi APs on channel 36, 40 and 44.
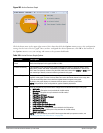
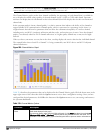
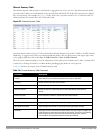
Table 208 describes the other values that can be displayed in the Active Devices Trend chart. Click the down arrow
in the upper right corner of this chart then click the Options menu to access the Active Devices Trend
configuration settings. Once you have configured the desired parameters, click OK at the bottom of the Options
menu to save your settings and return to the spectrum dashboards.
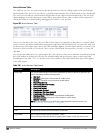
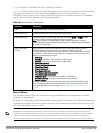
Parameter Description
Band Radio band displayed in this graph (2.4 GHz or 5 GHz).
Show Trend for Last Amount of elapsed time for which this chart should display data.
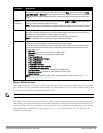
Channel Numbering
For spectrum monitors using the 5 GHz radio band, select either 20 MHz or 40 MHz channel
numbering to identify a channel numbering scheme for the graph.
NOTE: This parameter is not configurable for graphs created by hybrid APs or spectrum
monitor radios that use the 2.4 GHz radio band. A hybrid AP on a 20 MHz channel sees 40 MHz
Wi-Fi data as non-Wi-Fi data.
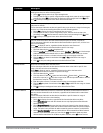
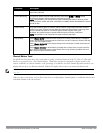
Show lines for these
channels
The Active Devices Trend chart can display values for up to five different device types on
different channels for a spectrum monitor, or a single device type for a hybrid AP.
To choose which type of data each line should represent, click the channel number drop-down
list and select a channel within the radio band, then click the device type drop-down list and
select one of the following device types.
l WiFi (AP)
l Microwave
(This option is only available for 2.4 GHz radios)
l Bluetooth
(This option is only available for 2.4 GHz radios)
l Fixed Freq (Others)
l Fixed Freq (Cordless Phones)
l Fixed Freq (Video)
l Fixed Freq (Audio)
l Freq Hopper (Others)
l Freq Hopper (Cordless Network)
l Freq Hopper (Cordless Base)
l Freq Hopper Xbox
(This option is only available for 2.4 GHz radios)
l Microwave (Inverter)
(This option is only available for 2.4 GHz radios)
l Generic Interferer
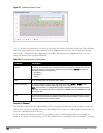
Select the checkbox beside each channel and device entry to show that information on the
chart, or unselect the checkbox to hide that information. For more information on non-Wi-Fi
device types detected by a spectrum monitor, see "Working with Non-Wi-Fi Interferers " on
page 606.
Table 208:
Active Devices Trend Options
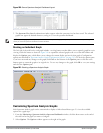
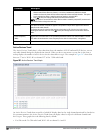
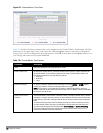
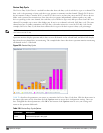
Channel Metrics
This stacked bar chart can show one of three different types of channel metrics;
channel utilization
,
channel
availability
, or
channel quality
.
By default, this chart displays channel utilization data, showing both the percentage of each monitored channel that
is currently being used by Wi-Fi devices, and the percentage of each channel being used by non-Wi-Fi devices and
802.11 adjacent channel interference (ACI).
NOTE: ACI refers to the interference on a channel created by a transmitter operating in an adjacent channel. A transmitter on a
nonadjacent or partially overlapping channel may also cause interference, depending on the transmit power of the interfering
transmitter and/or the distance between the devices. In general, ACI may be caused by a Wi-Fi transmitter or a non-Wi-Fi interferer.
However, whenever the term ACI appears in Spectrum Analysis graphs, it refers to the ACI caused by Wi-Fi transmitters. The
channel utilization option in the Channel Metrics Chart shows the percentage of the channel utilization due to both ACI and non-Wi-
DellPowerConnectW-SeriesArubaOS6.2 | User Guide Spectrum Analysis | 588