


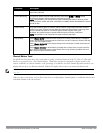

configuration settings. Once you have configured the desired parameters, click OK at the bottom of the Options
menu to save your settings and return to the spectrum dashboards.
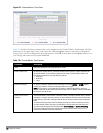
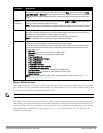
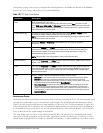
Parameter Description
Band Radio band displayed in this graph.
For spectrum monitor radios using the 5 GHz radio band, click the Band drop-down list and
select 5 GHz upper, 5GHz middle or 5Ghz lower to display data for that portion of the 5Ghz radio
band. This parameter is not configurable for graphs created by hybrid APs or spectrum monitor
radios that use the 2.4 GHz radio band.
Channel Numbering
For spectrum monitors using the 5 GHz radio band, select either 20 MHz or 40 MHz channel
numbering to identify a channel numbering scheme for the graph.
NOTE: This parameter is not configurable for graphs created by hybrid APs or spectrum monitor
radios that use the 2.4 GHz radio band.
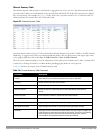
X-Axis Select either Channel or Frequency to show the duty cycle for a range of channels or
frequencies.
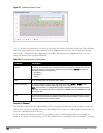
Channel Range If you selected Channel in the X-Axis parameter, you must also specify a channel range to
determine which channels appear in the x-axis of this chart. Click the first drop-down list to
select the lowest channel in the range, then click the second drop-down list to select the
highest channel to appear in the chart.
NOTE: This parameter is not configurable for graphs created by hybrid APs.
Center Frequency If you selected Frequency in the X-Axis parameter, enter the frequency, in MHz, that you want to
appear in the center of the x-axis of this chart.
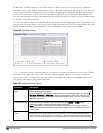
Span If you selected
Frequency
in the
X-Axis
parameter, specify the size of the range of frequencies
around the selected center frequency. If you set a frequency span of 100 MHz, for example, the
chart
shows t
he FFT duty cycle for a range of frequencies from 50MHz lower to 50 MHz higher
than the selected center.
Show Select a checkbox to display that information on the FFT Duty Cycle chart.
l Duty Cycle: The percentage of duty cycle the channel or frequency was actively utilized.
l Max Hold: The maximum recorded percentage of active duty cycles for the channel
frequency since the chart was last reset. To clear this setting, click the down arrow at the
end of the title bar for this graph and select Reset MaxHold.
l Max of last sweeps: By default, this chart shows the maximum percentage of active duty
cycles for the channel of frequency recorded during the last 10 sweeps. To change the
number of sweeps used to determine this value, enter a number from 2 to 20, inclusive. To
clear this setting, click the down arrow at the end of the title bar for this graph and select
Reset MaxNSweep.
Table 222:
FFT Duty Cycle Options
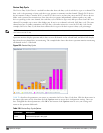
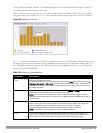
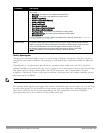
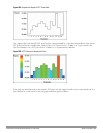
Interference Power
The Interference Power chart displays various power levels of interest, including the Wi-Fi AP with maximum signal
strength, noise, and interferer types with maximum signal strength. The ACI displayed in the Interference Power
Chart is the ACI power level based on the signal strength(s) of the Wi-Fi APs on adjacent channels. A higher ACI
value in Interference Power Chart does not necessarily mean higher interference since the AP that is contributing to
the maximum ACI may or may not be very actively transmitting data to other clients at all times. The ACI power
levels are derived from the signal strength of the beacons.
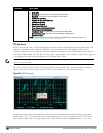
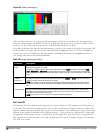
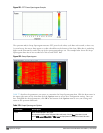
This chart displays the noise floor of each selected channel in dBm. The noise floor of a channel depends on the
noise figure of the RF components used in the radio, temperature, presence of certain types of interferers or noise,
and the width of the channel. For example, in a clean RF environment, a 20 MHz channel has a noise floor around -
DellPowerConnectW-SeriesArubaOS6.2 | User Guide Spectrum Analysis | 598