


User’s Manual
Preliminary PPC440x5 CPU Core
debug.fm.
September 12, 2002
Page 219 of 589
8. Debug Facilities
The debug facilities of the PPC440x5 include support for several debug modes for debugging during hard-
ware and software development, as well as debug events that allow developers to control the debug process.
Debug registers control these debug modes and debug events. The debug registers may be accessed either
through software running on the processor or through the JTAG debug port of the PPC440x5 core. Access to
the debug facilities through the JTAG debug port is typically provided by a debug tool such as the RISC-
Watch™ development tool from IBM. A trace port, which enables the tracing of code running in real time, is
also provided.
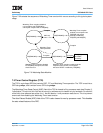
8.1 Support for Development Tools
The RISCWatch product from IBM is an example of a development tool that uses external debug mode,
debug events, and the JTAG debug port to implement a hardware and software development tool. The RISC-
Trace™ feature of RISCWatch is an example of a development tool that uses the real-time instruction trace
capability of the PPC440x5 core.
8.2 Debug Modes
The following sections describe the various debug modes supported by the PPC440x5. Each of these debug
modes supports a particular type of debug tool or debug task commonly used in embedded systems develop-
ment. For all debug modes, the various debug event types are enabled by the setting of corresponding fields
in Debug Control Register 0 (DBCR0), and upon their occurrence are recorded in the Debug Status Register
(DBSR).
There are four debug modes:
• Internal debug mode
• External debug mode
• Debug wait mode
• Trace debug mode
The PowerPC Book-E architecture specification deals only with internal debug mode, and the relationship of
Debug interrupts to the rest of the interrupt architecture. Internal debug mode is the mode which involves
debug software running on the processor itself, typically in the form of the Debug interrupt handler. The other
debug modes, on the other hand, are outside the scope of the architecture, and involve special-purpose
debug hardware external to the PPC440x5 core, connected either to the JTAG interface (for external debug
mode and debug wait mode) or the trace interface (for trace debug mode). Details of these interfaces and
their operation are beyond the scope of this manual.
8.2.1 Internal Debug Mode
Internal debug mode provides access to architected processor resources and supports setting hardware and
software breakpoints and monitoring processor status. In this mode, debug events are considered excep-
tions, which, in addition to recording their status in the DBSR, generate Debug interrupts if and when such
interrupts are enabled (Machine State Register (MSR) DE field is 1; see Interrupts and Exceptions on