User’s Manual
Preliminary PPC440x5 CPU Core
debug.fm.
September 12, 2002
Page 221 of 589
Debug wait mode is enabled by setting both MSR[DWE] and the debug wait mode enable within the JTAG
controller to 1. Since MSR[DWE] is automatically cleared upon any interrupt, debug wait mode is temporarily
disabled upon an interrupt, and then can be automatically re-enabled when returning from the interrupt due to
the restoration of the MSR value upon the execution of an rfi, rfci, or rfmci instruction.
While debug wait mode can be enabled in combination with external debug mode, external debug mode
takes precedence and interrupts are temporarily disabled, thereby effectively nullifying the effect of debug
wait mode. Similarly, debug wait mode can be enabled in combination with internal debug mode. However, if
Debug interrupts are enabled (MSR[DE] is 1), then any debug event will lead to an exception and a corre-
sponding Debug interrupt, which takes precedence over the stop state associated with debug wait mode. On
the other hand, if Debug interrupts are disabled (MSR[DE] is 0), then debug wait mode will take effect and a
debug event will cause the processor to enter stop state.
8.2.4 Trace Debug Mode
Trace debug mode is simply the absence of each of the other modes. That is, if internal debug mode, external
debug mode, and debug wait mode are all disabled, then the processor is in trace debug mode. While in trace
debug mode, all debug events are simply recorded in the DBSR, and are indicated over the trace interface
from the PPC440x5 core. The processor does not enter the stop state, nor does a Debug interrupt occur.
8.3 Debug Events
There are several different kinds of debug events, each of which is enabled by a field in DBCR0 (except for
the Unconditional debug event) and recorded in the DBSR. Debug Modes on page 219 describes the opera-
tion that results when a debug event occurs while operating in any of the debug modes.
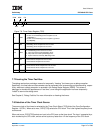
Table 8-1 lists the various debug events recognized by the PPC440x5. Detailed explanations of each debug
event type follow the table.
Table 8-1. Debug Events
Event Description
Instruction Address Compare (IAC)
Caused by the attempted execution of an instruction for which the address matches the
conditions specified by DBCR0, DBCR1, and the IAC1–IAC4 registers.
Data Address Compare (DAC)
Caused by the attempted execution of a load, store, or cache management instruction
for which the data storage address matches the conditions specified by DBCR0,
DBCR2, and the DAC1–DAC2 registers.
Data Value Compare (DVC)
Caused by the attempted execution of a load, store, or cache management instruction
for which the data storage address matches the conditions specified by DBCR0,
DBCR2, and the DAC1–DAC2 registers, and for which the referenced data matches
the value specified by the DVC1–DVC2 registers.
Branch Taken (BRT)
Caused by the attempted execution of a branch instruction for which the branch condi-
tions are met (that is, for a branch instruction that results in the re-direction of the
instruction stream).
Trap (TRAP)
Caused by the attempted execution of a tw or twi instruction for which the trap condi-
tions are met.
Return (RET) Caused by the attempted execution of an rfi, rfci, or rfmci instruction.


