


High-performance Embedded Workshop 17. Using the Debugger
REJ10J1837-0100 Rev.1.00 Nov. 16, 2008
273
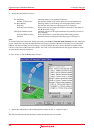
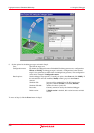
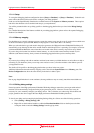
17.1.4.1 Setup
To set-up the debugging platform configuration choose [Setup -> Simulator] or [Setup -> Emulator]. Under this sub
menu will be the menus which can be used to configure your debug platform.
In the case of the SuperH family Simulator the available menus are the System and Memory resource. These options
both allow the simulator to be customized and setup to your requirements.
You will be presented with a set-up dialog specific to the debugging platform that you chose in the Debug Settings
dialog.
For a detailed description of the features available in your debugging platform, please refer to the separate Debugging
Platform User Manual.
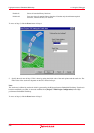
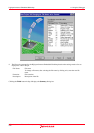
17.1.4.2 Memory mapping
For the debugger to correctly represent your user system, the memory map must be set up. It needs to know which areas
in the device's address space are RAM, ROM, on-chip registers or areas where there is no memory.
When you select the device type and mode in the project generator, the High-performance Embedded Workshop will
automatically set up the map for that device and the mode in which the processor is operating. For example, in a device
with internal ROM and RAM, the areas where these are located in the device's memory map will be set by default.
If you are using a device that does not have internal memory, or a device with external memory instead of (or in
addition to) the internal memory, then you must tell the debugging platform that you have memory there.
Tip:
If you are trying to debug code with an emulator and need some memory available that does not exist either on-chip or
externally (in your hardware), then you can map some emulation memory from the emulator to the address space for
your application to use.
The details will be specific to the debugging platform that you chose in the new project.
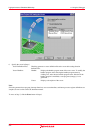
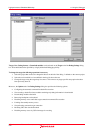
Additional information about the memory mapping can be viewed in the System Status view's Memory pane. The
Device Configuration area shows how the memory in the device's address space.
Note:
Due to page length limitations in some emulators, the range addresses may not exactly match the entered addresses.
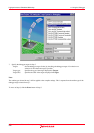
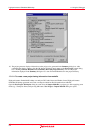
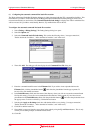
17.1.4.3 Editing debug settings
Normal operation of the High-performance Embedded Workshop debugger means that your target and download
modules will be automatically configured in the project generation process. However in some cases it may be
necessary for you to manually configure your debug session. This is often the case when using old toolchains and
project generators that do not support the latest High-performance Embedded Workshop interfaces.
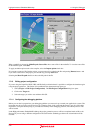
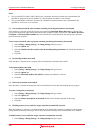
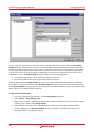
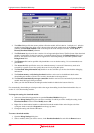
To check your debug session setup display the Debug Settings dialog box. Select one of the following operations
• Select [Debug -> Debug Settings], OR
• Right-click on the download module or within the Download modules folder on the Projects tab of the
workspace window and select Debug Settings from the pop-up menu.