


High-performance Embedded Workshop 17. Using the Debugger
REJ10J1837-0100 Rev.1.00 Nov. 16, 2008
352
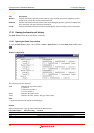
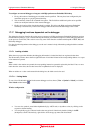
Tab Description
Memory
Contains information about the current memory status including the memory mapping resources
and the areas used by the currently loaded object file.
Platform
Contains information about the current status of the debugging platform, typically including CPU
series and mode, run status and timing information.
Events
Contains information about the current event (breakpoint) status, including resource information.
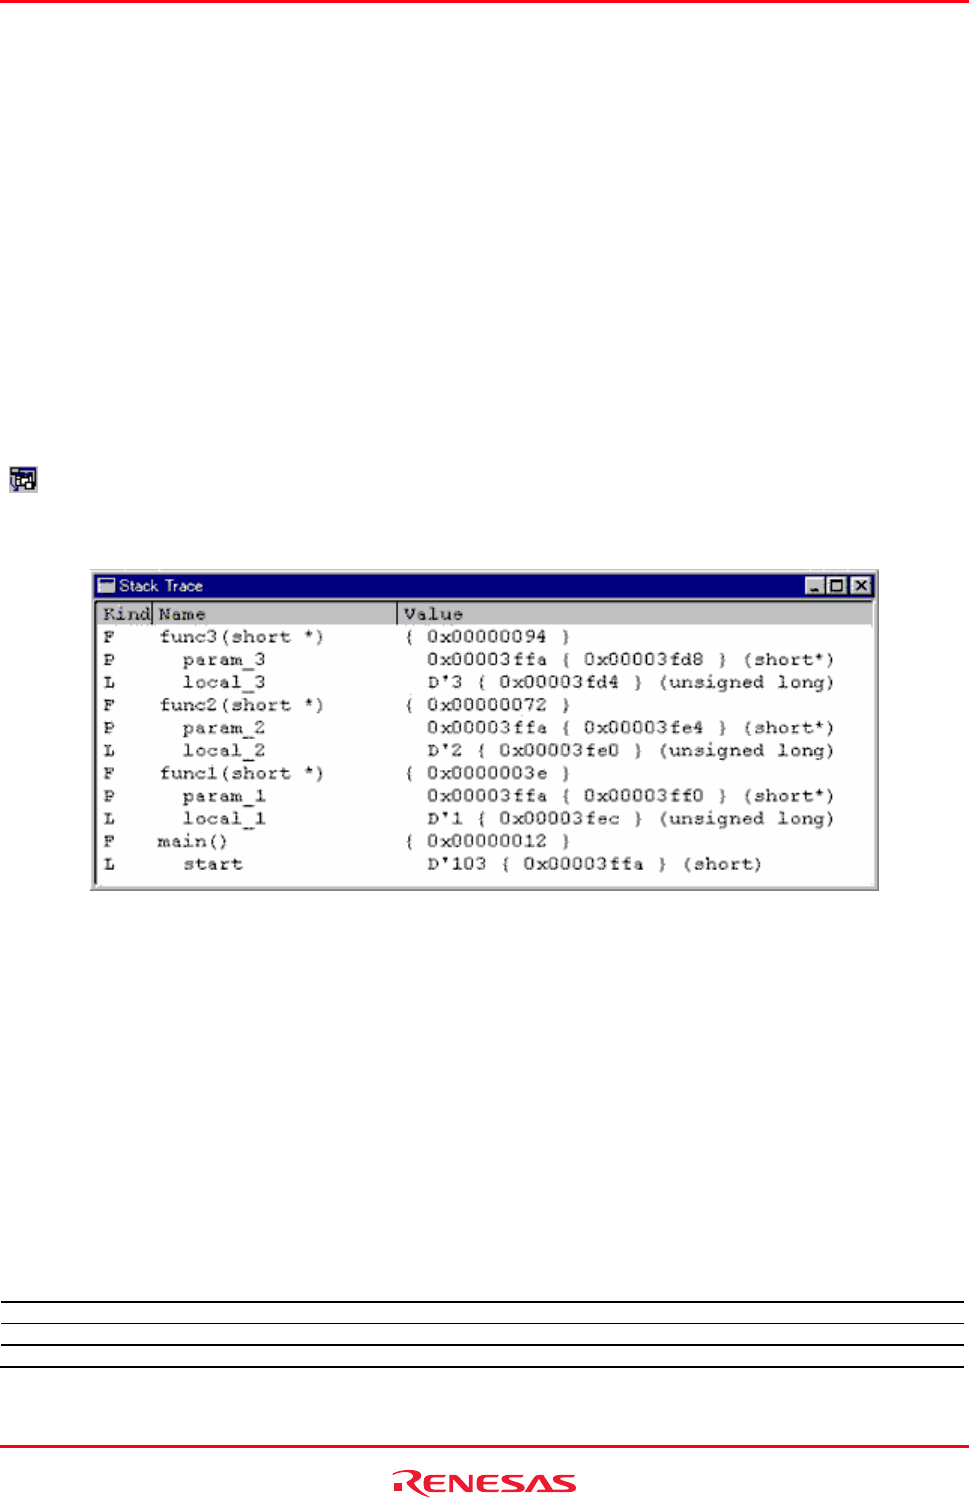
17.15 Viewing the function call history
The Stack Trace window shows the function call history.
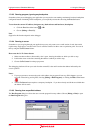
17.15.1 Opening the Stack Trace window
To open
the Stack Trace window, choose [View -> Code -> Stack Trace] or click the Stack Trace toolbar button
(
).
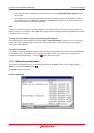
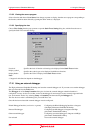
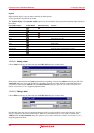
Window configuration
The following items are displayed.
Kind Indicates the type of the symbol.
F: Function
P: Function parameter *
L: Local variable *
Name Indicates the symbol name.
Value Indicates the value, address, and type of the symbol.
Note:
*. Support for this function depends on the debugger.
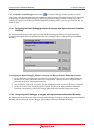
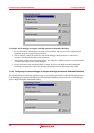
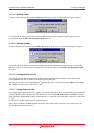
Options
Right-clicking displays a pop-up menu containing available options.
Pop-up Menu Option Macro Recording Function
Go to Source - Go to the associated source line.
View Setting - Specifying the Stack Trace window settings.
Copy - Places a copy of the highlighted text into the Windows® clipboard.