


High-performance Embedded Workshop 18. Synchronized Debugging
REJ10J1837-0100 Rev.1.00 Nov. 16, 2008
387
18.2.3 Internal mode functionality
General operation
When using internal mode all Debuggers are opened in the one High-performance Embedded Workshop application.
The state of the GUI can be switched (by various methods) to debug the different open Debuggers. When the GUI is
switched to a Debugger the debug views will change to show data on that Debugger and any operations executed from
then on will be executed on that Debugger (referred to as the “active Debugger”). This allows you to debug several
platforms, or several cores on a multi-core platform, using one High-performance Embedded Workshop application.
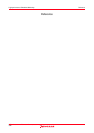
High-performance Embedded Workshop window title
The High-performance Embedded Workshop window title will start with the display ID of the current Debugger. This
will change whenever the active Debugger is changed.
Switching the active Debugger
There are several methods of switching the active Debugger.
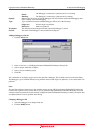
Debuggers tab: Right clicking on a Debugger in the tab and selecting “Activate” will make it the
active Debugger.
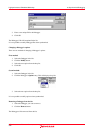
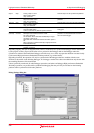
Application toolbar: When debugging in internal mode an extra drop list is added to the application
toolbar. This contains the project/session combination that describes each
synchronized Debugger. The active debugger can be changed to a specific
Debugger by selecting its session in the drop list.
Shortcut key combination: Pressing the Ctrl+Shift+N Key combination will change the active Debugger to
the next one in the Debuggers tab.
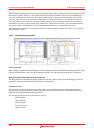
The Output Window
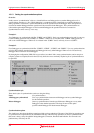
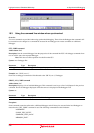
When using Internal mode the Output Window displays a separate “Debug” tab for each synchronized Debugger. Each
tab includes the project name and session name of the Debugger it represents so that it can be identified.