


High-performance Embedded Workshop 17. Using the Debugger
REJ10J1837-0100 Rev.1.00 Nov. 16, 2008
351
3. It is possible to enable or disable the current breakpoint by selecting [Enable/Disable Breakpoint] from the
pop-up menu.
4. Now when you run your program and it reaches the address at which you set the PC breakpoint, execution
halts with the message ‘PC Breakpoint’ displayed in the Debug pane, and the source or disassembly view is
updated with the PC breakpoint line highlighted.
Note:
The line or instruction at which you set a PC breakpoint is not actually executed – the program stops just before it is
about to execute it. If you choose to Go or Step after stopping at the PC breakpoint, then the highlighted line will be the
next instruction to be executed.
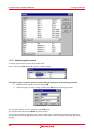
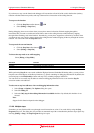
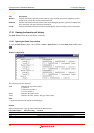
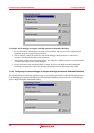
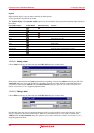
To change the PC breakpoint setting by using the Breakpoints dialog box
The breakpoint dialog can be displayed by selecting [Edit -> Source Breakpoints]. It allows you to view the current
breakpoints set in the workspace and view the code associated with each one. From this dialog it is also possible to
remove one or all breakpoints.
To toggle PC breakpoints
It is possible to toggle PC Breakpoints either by double-clicking in the breakpoint (BP) column of the line at which the
PC breakpoint is set, or by placing the caret on the line and using the F9 key. The display will cycle through the
available standard breakpoint types – a red circle (
) will be shown in the gutter.
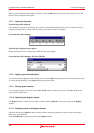
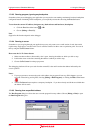
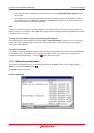
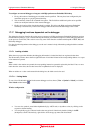
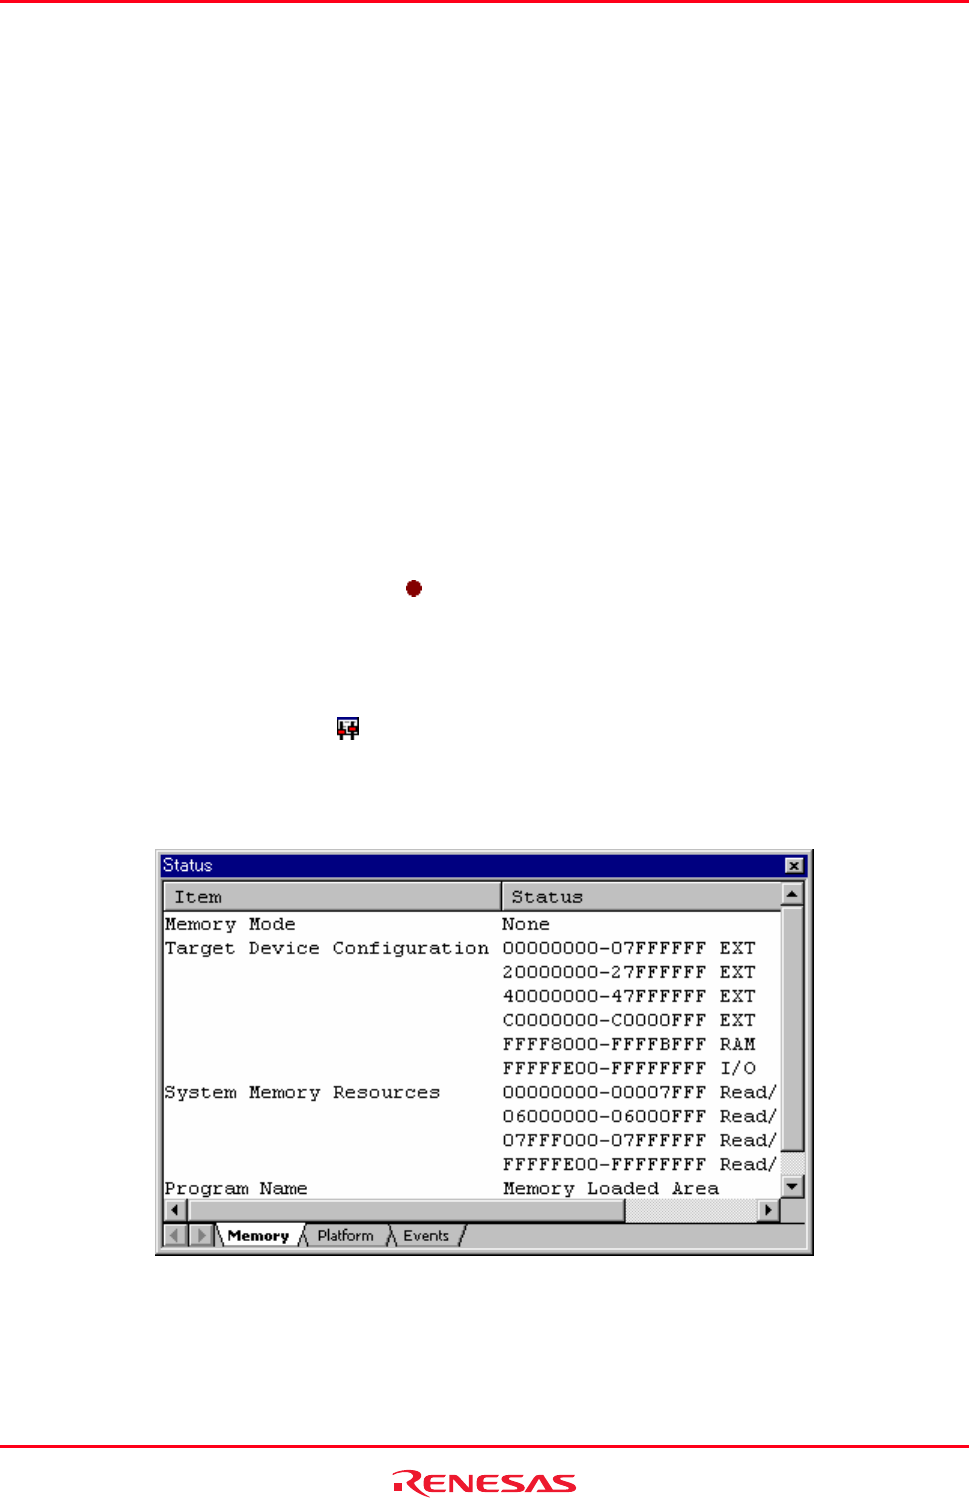
17.14 Viewing the current status
To check the configuration and status of the debugging platform in the Status window, choose [View -> CPU ->
Status], or click the View Status button (
).
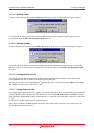
The Status window has three tabs.
Window configuration