


High-performance Embedded Workshop 17. Using the Debugger
REJ10J1837-0100 Rev.1.00 Nov. 16, 2008
308
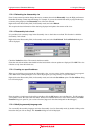
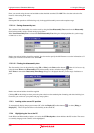
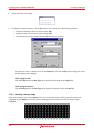
Enter your search string, the start and end address that should be searched. Click OK. The view then selects the first
instance of that string in the range.
Note:
Subsequent find operations will find strings only in the paged disassembly area not the complete range.
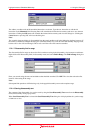
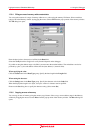
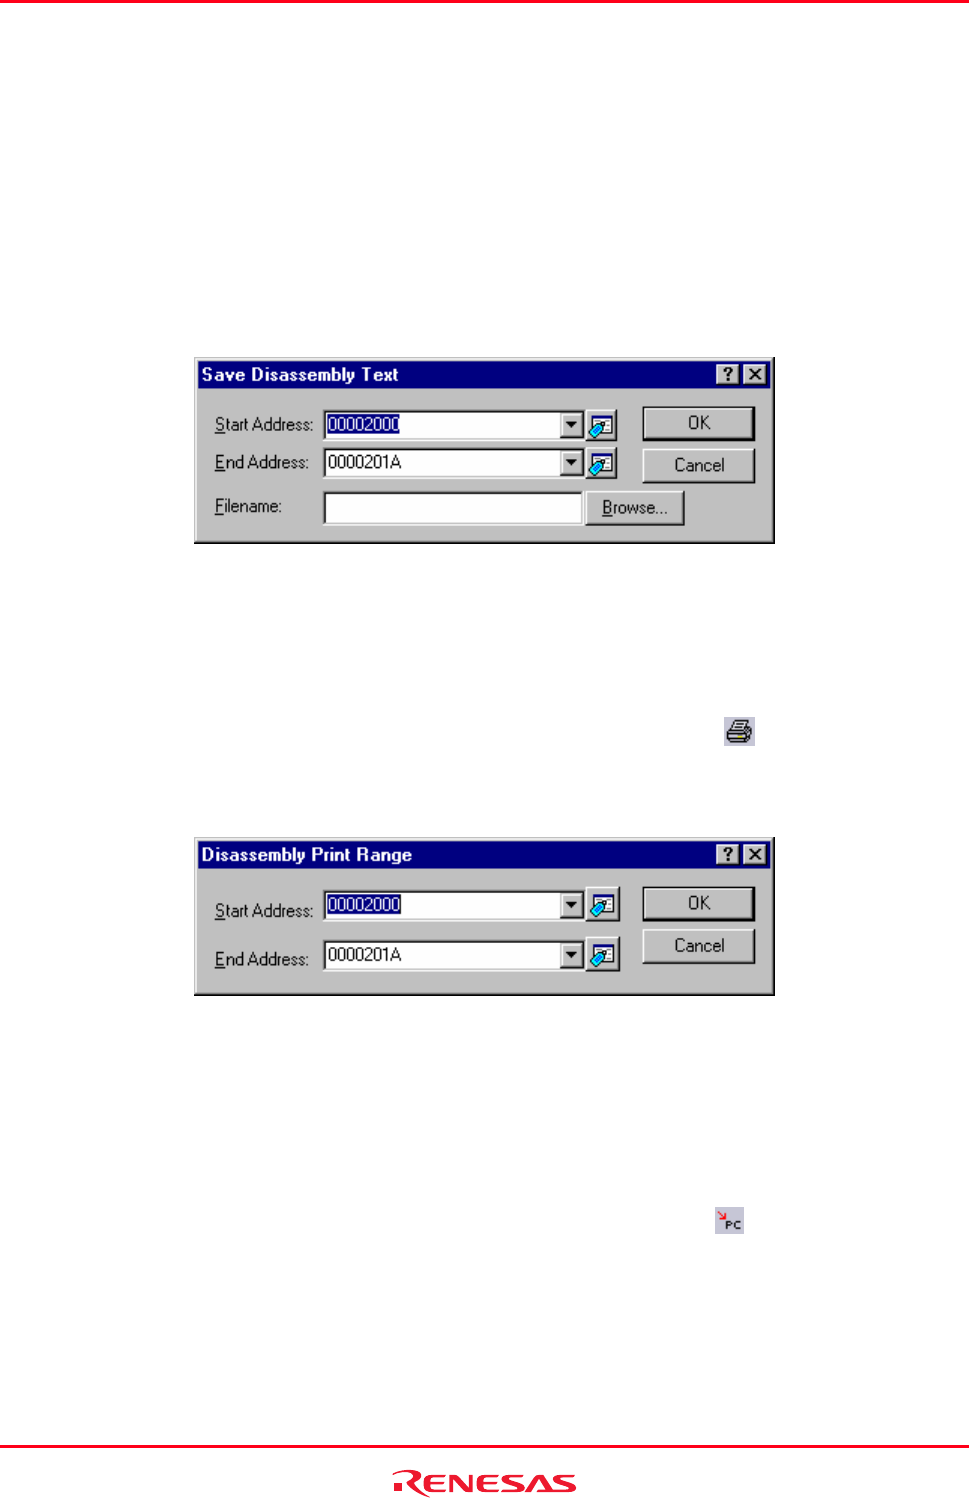
17.2.2.11 Saving disassembly text
The contents of the disassembly view can be saved by using the Save Disassembly Text menu from the Disassembly
field (in disassembly mode or mixed mode) pop-up menu.
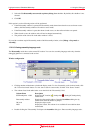
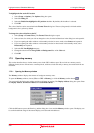
When Save Disassembly Text is selected the Save Disassembly Text dialog box is displayed that asks you the range
of addresses to save.
Both a start and end address should be supplied. You also need to specify the full filename to save the information to. If
needed you can browse to the file to use. Click OK.
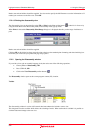
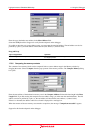
17.2.2.12 Printing the disassembly view
The disassembly view can be printed by using [File -> Print] or the Print toolbar button (
) when it is in focus or by
using the menu Print on the Disassembly field (in disassembly mode or mixed mode) pop-up menu.
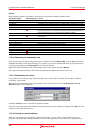
When Print is selected the Disassembly Print Range dialog box is displayed that asks you the range of addresses to
print.
Both a start and end address should be supplied.
Clicking OK on this dialog box then passes the print selection to the standard print formatting and selection dialog box.
From here you can choose your printer and page setup options.
17.2.3 Looking at the current PC position
To
automatically display the program counter (PC) click the Display PC toolbar button (
), or select [Debug ->
Display PC]. This will open the editor or disassembly at the current PC.
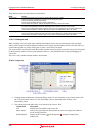
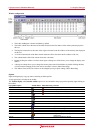
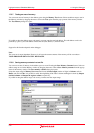
17.2.4 Highlighting the line at the PC
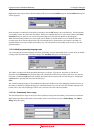
In th
e Editor and Disassembly windows, an icon in the S/W Breakpoints column indicates the PC location. The source
or assembly-language code at the PC can be highlighted.