


High-performance Embedded Workshop 17. Using the Debugger
REJ10J1837-0100 Rev.1.00 Nov. 16, 2008
356
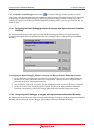
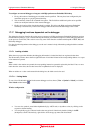
To configure an external debugger to integrate with High-performance Embedded Workshop
1. Firstly, the location of the debugger executable must be specified. This may have been configured by the
installation program or a project generation utility.
2. The second item of data is the command line options. This field allows additional options to be specified
which can modify the behavior of the external debugger.
3. Finally, the location of the download module is required. This allows the High-performance Embedded
Workshop to automatically switch to the debugger when the download module changes after a build.
17.17 Debugging functions dependent on the debugger
The debugging functions listed in this section are not common to all High-performance Embedded Workshop products
included in tool packages. (User’s manual and help information just include descriptions of these debugging functions
as the previous version did.) This section covers only some of the functions available with SuperH or H8SX, H8S, and
H8 family debugger.
For other functions dependent on the debugger, see the user’s manual or help information packaged with the emulator
or simulator.
17.17.1 Looking at labels
Whe
n the user program that includes the debugging information is loaded, the labels are registered at that time.
The Disassembly window shows the first eight characters of each label instead of the corresponding address or as a part
of an instruction operand.
Note:
When a label value matches an operand, the corresponding instruction operand is replaced by the label. If two or more
labels have the same value, the one that comes first in alphabetical order is displayed.
When an address or a value can be entered in the dialog box, the labels can also be used.
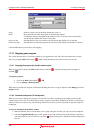
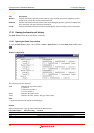
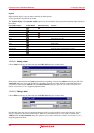
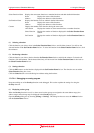
17.17.1.1 Listing labels
To see a list of all the labels defined in the current debugger session, choose [View -> Symbol -> Labels] or click the
View Labels toolbar button (
).
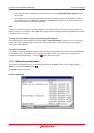
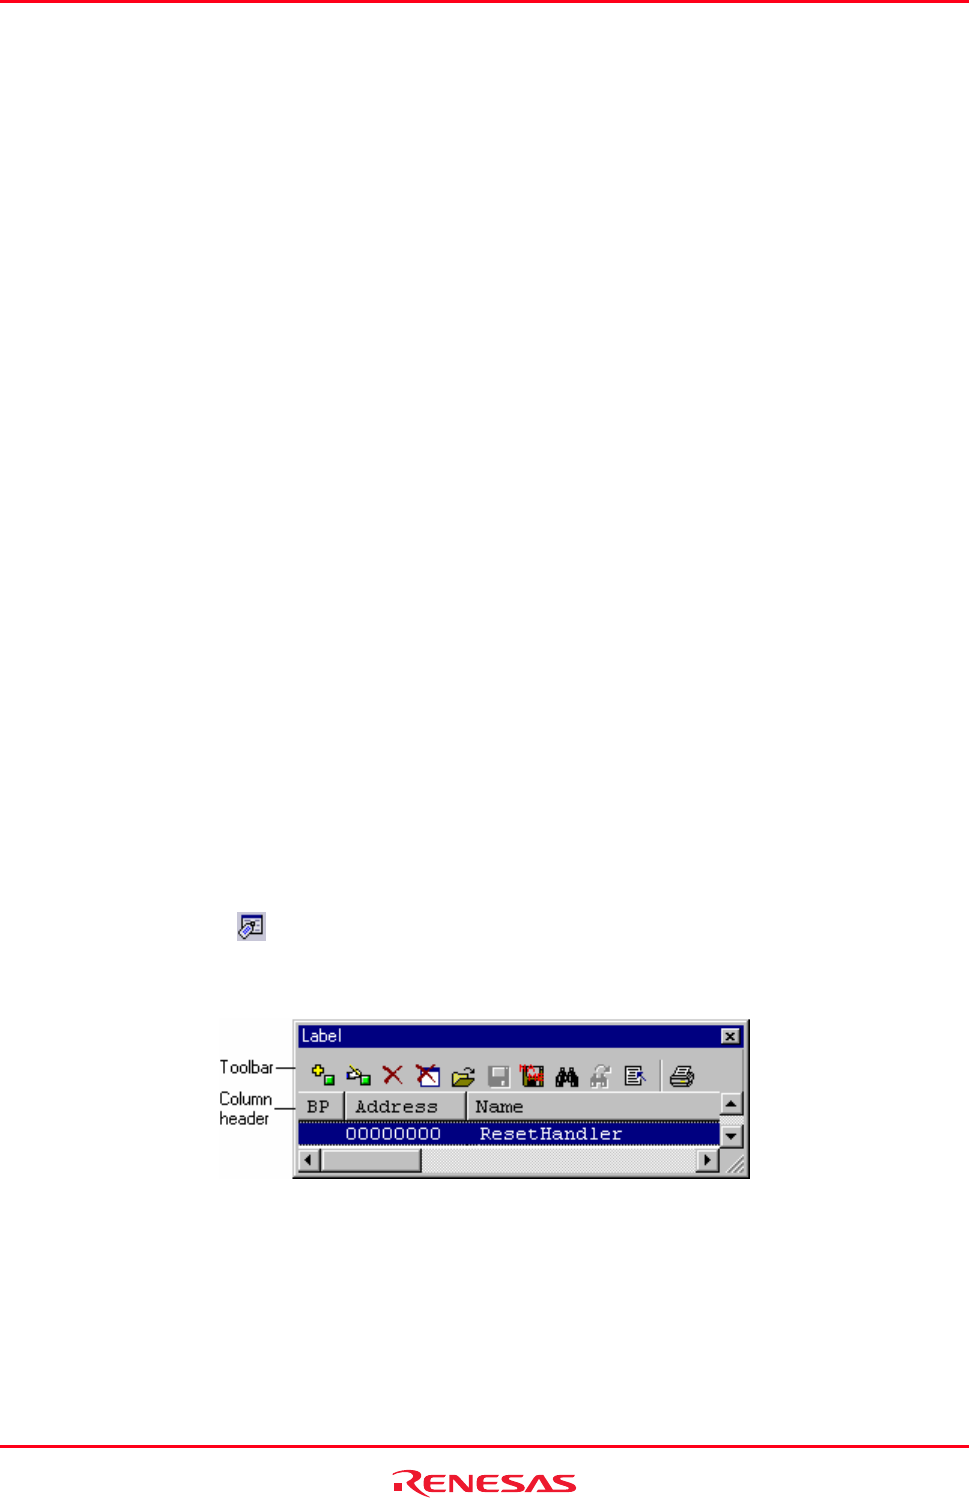
Window configuration
• You can view symbols, sorted either alphabetically (by ASCII code) or by address value, by clicking on the
respective column heading.
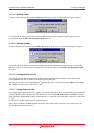
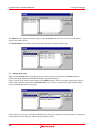
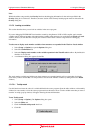
• You can quickly toggle a software break at the entry point of a function by double clicking in the BP
(breakpoint) column. Alternatively, right-click to show the pop-up menu and select Break.