


High-performance Embedded Workshop 17. Using the Debugger
REJ10J1837-0100 Rev.1.00 Nov. 16, 2008
309
To highlight the line at the PC location
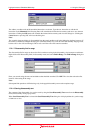
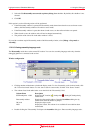
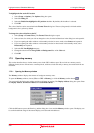
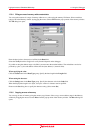
1. Select [Setup -> Options]. The Options dialog box opens.
2. Select the Debug tab.
3. Select the Enable line highlight for PC position checkbox. By default, this checkbox is selected.
4. Click OK.
The color of the line can be customized in the Format Views dialog box. The text (foreground) is in black and the
background color is yellow by default.
To change the colors of the line at the PC
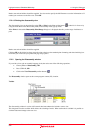
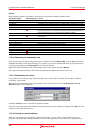
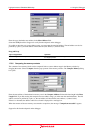
1. Select [Setup -> Format Views]. The Format Views dialog box opens.
2. Select an item, for which you wish to change the color, from the left-hand tree in the dialog box and expand it.
• If you are opening the editor window or disassembly window in source mode, select Source and expand it.
• If you are opening the editor window or disassembly window in mixed mode or disassembly mode, select
Disassembly and expand it.
3. Select the PC Line Highlight category.
4. Change the selection in the Foreground and Background lists of the Color tab.
5. Click OK.
17.3 Operating memory
This section describes how to look at memory areas in the CPU's address space. How to look at a memory area in
different formats, how to fill and move a memory block, and how to load and verify a memory area with a disk file are
described.
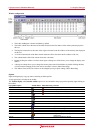
17.3.1 Opening the Memory window
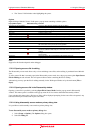
The Mem
ory window displays the contents of contiguous memory areas.
To open the Memory window, choose [View -> CPU -> Memory], or click the Memory toolbar button (
).
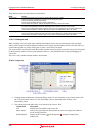
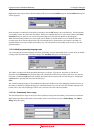
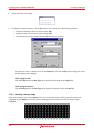
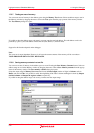
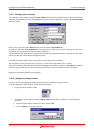
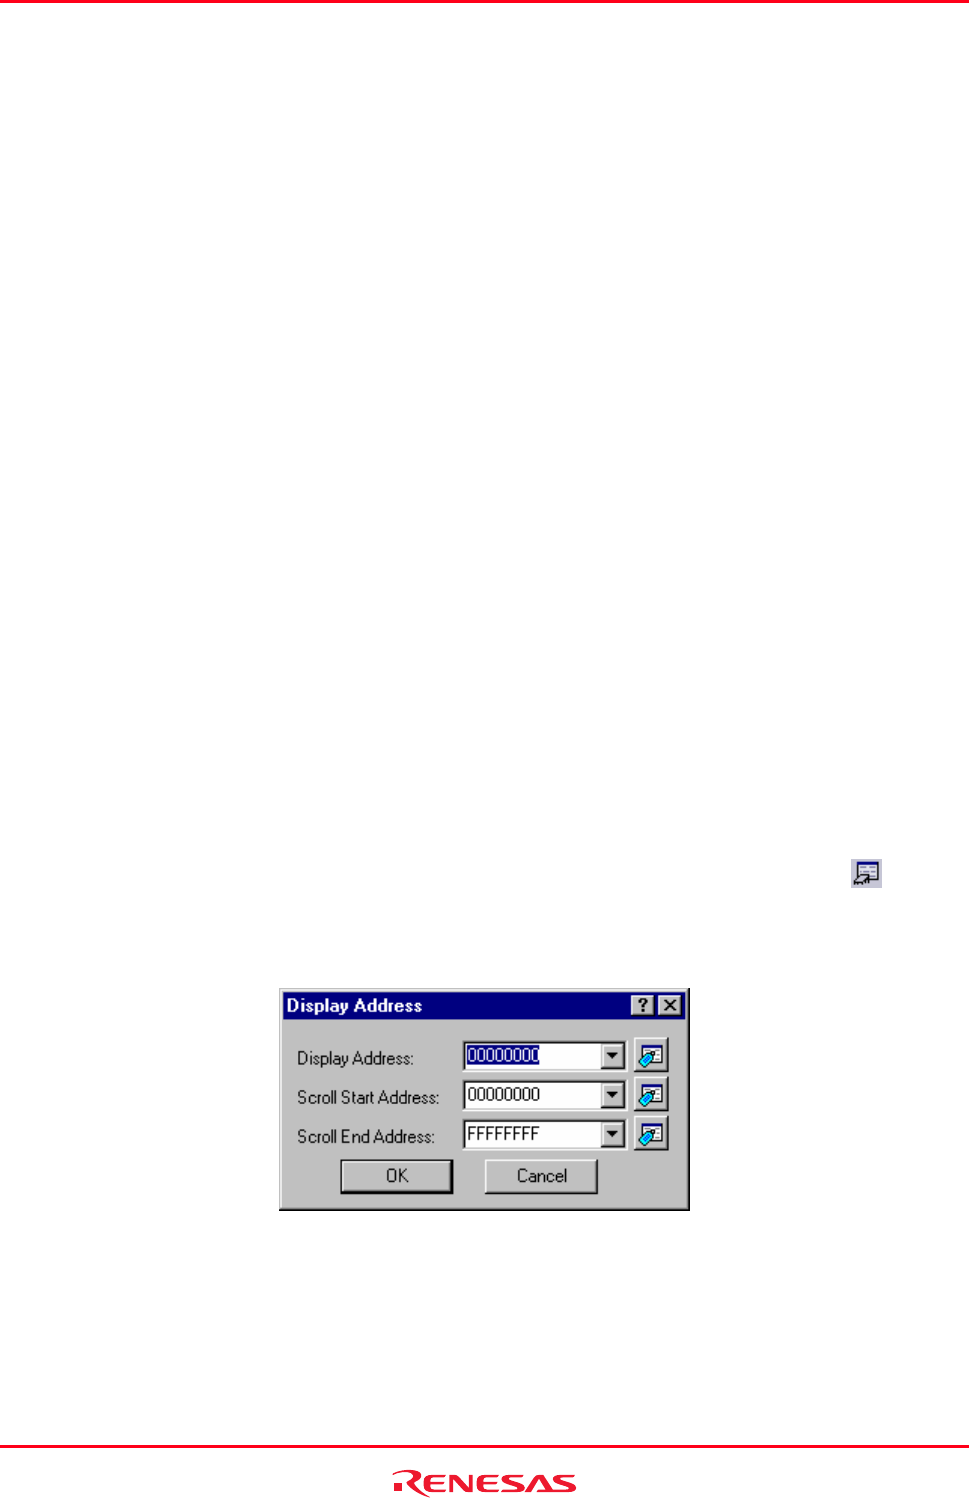
You can specify the display start address and the scroll range at opening. The Display Address dialog box opens. Enter
the Display Address, Scroll Start Address and Scroll End Address.
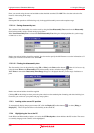
Click the OK button or press the Enter key, and the dialog box closes and the Memory window opens. The display can
be scrolled within the range of the entered display scroll start and end addresses.