


High-performance Embedded Workshop 17. Using the Debugger
REJ10J1837-0100 Rev.1.00 Nov. 16, 2008
353
17.15.2 Viewing the source program
Select a function and choose Go to Source from the pop-up menu to display, then the source program corresponding to
the function, which has been selected by opening the editor window, is displayed.
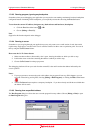
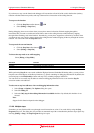
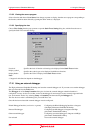
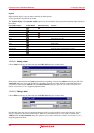
17.15.3 Specifying the view
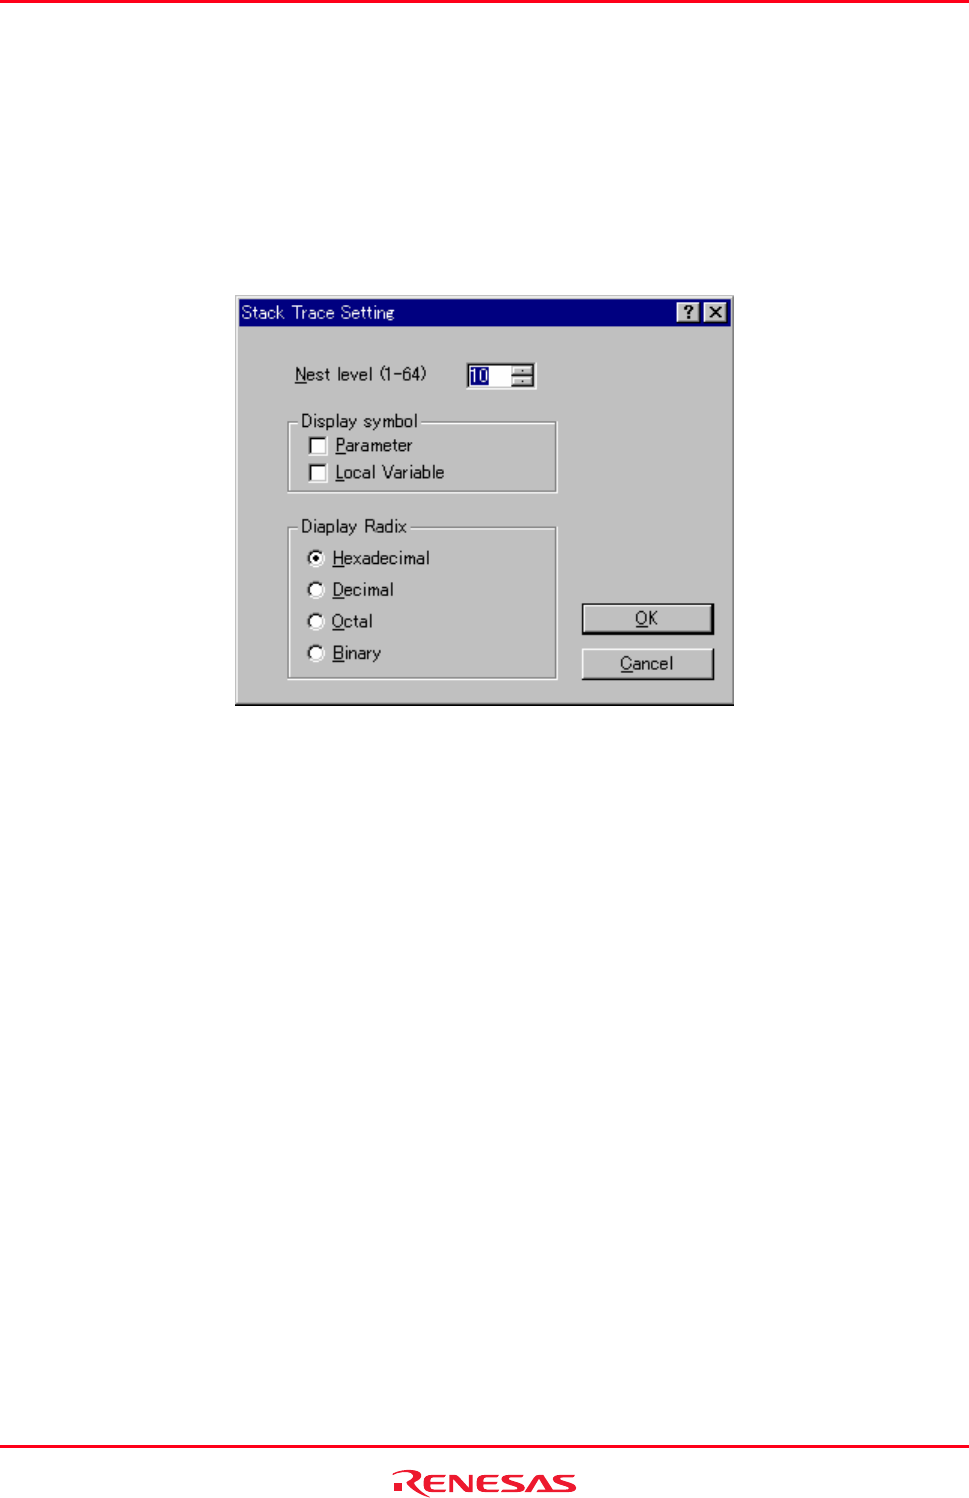
Ch
oose View Setting from the pop-up menu to open the Stack Trace Setting dialog box, which allows the user to
specify the Stack Trace window settings.
Nest level Specifies the level of function call nesting to be displayed in the Stack Trace window.
Display symbol
* Specifies the symbol types to be displayed in addition to functions.
Display Radix
* Specifies the radix for displays in the Stack Trace window.
Note:
*. Support for this function depends on the debugger.
17.16 Using an external debugger
The High-performance Embedded Workshop can launch an external debugger tool. If you want to use another debugger
then you must add it to the Tools menu.
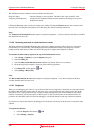
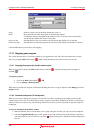
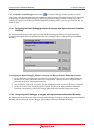
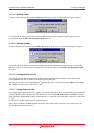
The Debugger tab of the Setup Customize dialog box is where the external debugger related information is
configured. You may wish to use an older version of the debugger if certain targets are not currently supported in the
new environment. Invoke it by selecting [Setup -> Customize] and then selecting the Debugger tab.
The first choice to make is which debug tool you would like to use.
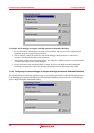
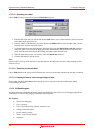
Once this has been selected the external debugger must be configured.
Hitachi Debugger Interface (version 4.x or greater) Configuring the Hitachi Debugging Interface to integrate
with High-performance Embedded Workshop
Renesas PD debugger Configuring the PD debugger to integrate with High-
performance Embedded Workshop
Other external debugger Configuring an external debugger to integrate with High-
performance Embedded Workshop
Non selected Not use the external debugger