Parameters
stack-unit
stack-unit
{command-
option}
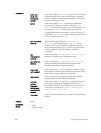
Enter the keywords stack-unit to select a particular stack
member and then enter one of the following command
options to display a collection of data based on the option
entered. The range is 0 to 11.
buffer Enter the keyword buffer. To display the total buffer
statistics for the stack unit, enter the keyword
total-
buffer. To display buffer statistics for a all interface, enter
the keyword
interface followed by the keyword all.
To display total buffer information for the port, enter the
keywords buffer-info. To display a queue range, enter 0
to 14 for a specfic queue or all.
cpu data-plane
statistics
(Optional) Enter the keywords cpu data-plane
statistics then the keywords stack port and its
number,
from 0 to 63 to display the data plane statistics,
which shows the High Gig (Higig) port raw input/output
counter statistics to which the stacking module is
connected.
cpu
management
statistics
Enter the keywords cpu management statistics to
display the counters of the management port.
cpu party-bus
statistics
Enter the keywords cpu party-bus statistics, to
display the Management plane input/output counter
statistics of the pseudo party bus interface.
drops [unit
unit-number]
Enter the keyword drops to display internal drops on the
selected stack member. Enter the drops keyword to display
internal drops on the selected stack member.
fpga register Enter the keyword to display the register value of fpga
resgister details in S4810, Z9000 and S6000.
unit unit-
number
{counters |
details | port-
stats [detail] |
register}
Enter the keyword unit then 0 to 3 and then enter one of
the following keywords to troubleshoot errors on the
selected port-pipe and to give status on why a port is not
coming up to register level: counters, details, port-
stats [detail], or register.
TI monitor Enter the unit keyword to show information regarding the TI
register.
Defaults none
Command
Modes
• EXEC
• EXEC Privilege
622
Debugging and Diagnostics


